
Dashboard software facilitates interactive data visualization to gain business insights.
As a data analyst or sales and marketing professional, you know how overwhelming it can be to visualize complex data sets and find meaningful insights.
Dashboard software can help remove the complexities of data visualization. These tools collect data from multiple sources and help users measure business performance in real time and gain meaningful insights in the form of graphs, charts, and tables.
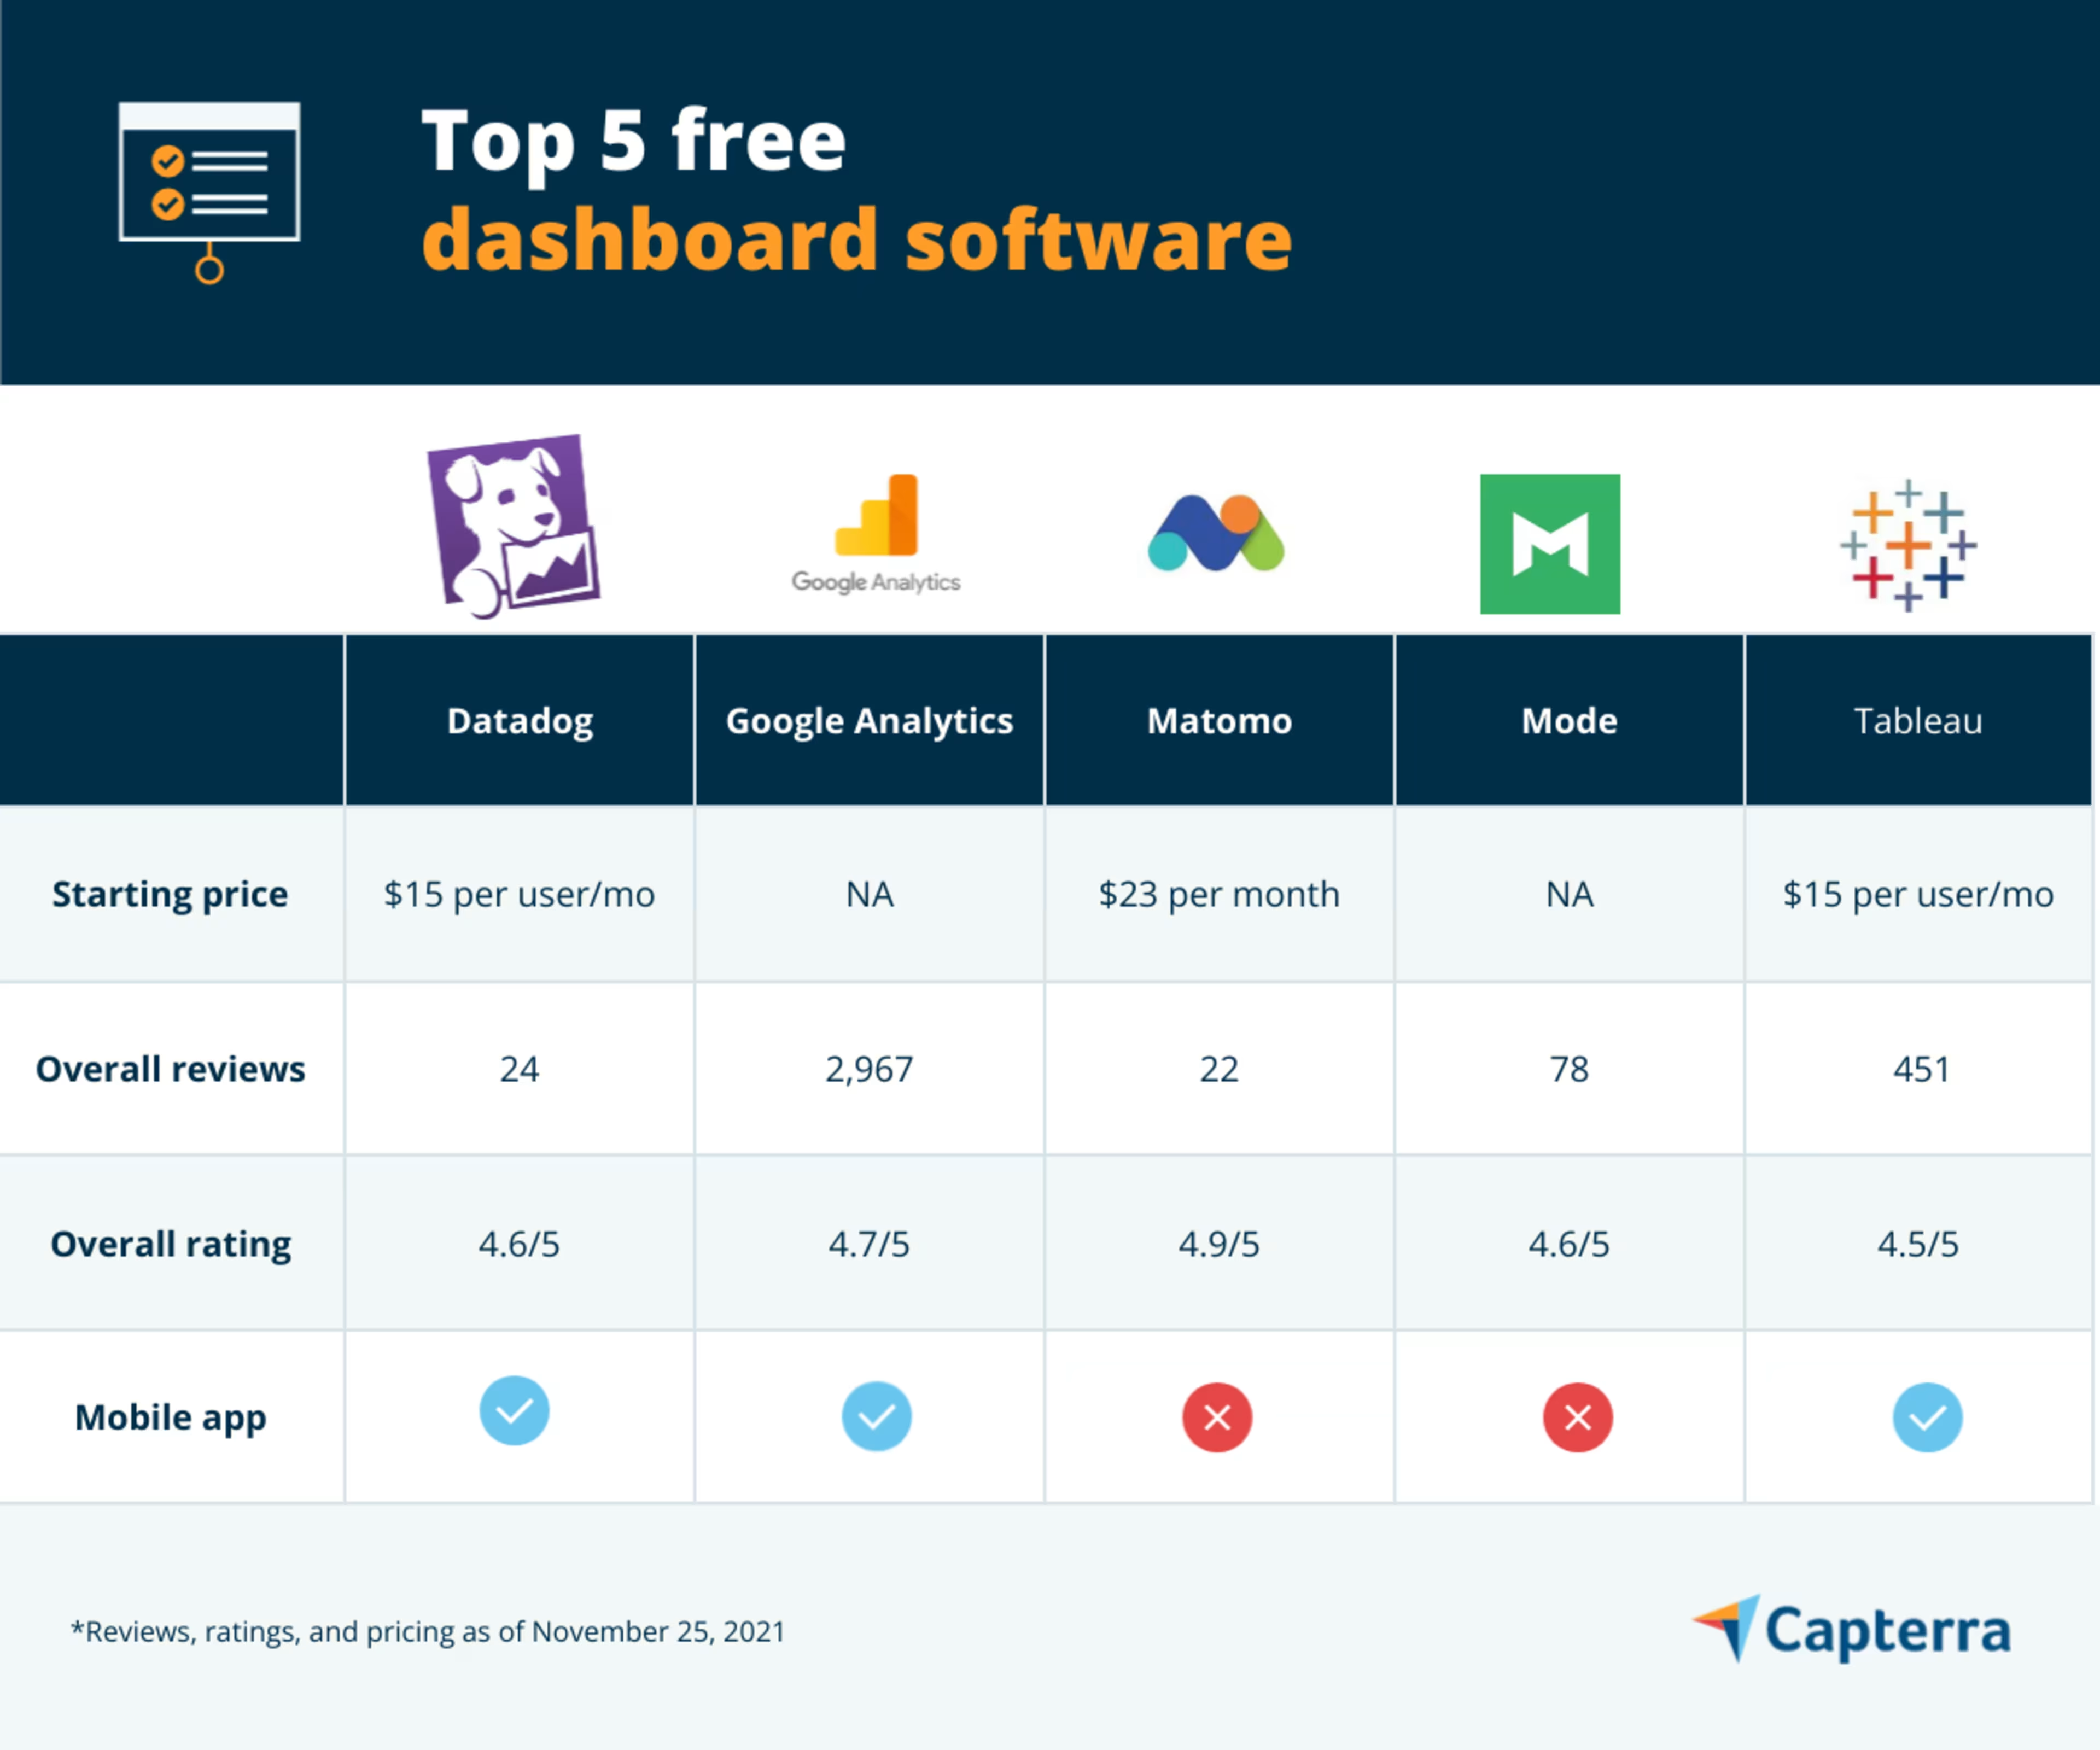
This article highlights five top free dashboard software options, presented alphabetically.
See the full list of free dashboard tools in Capterra’s software directory.

1. Datadog: Offers synthetic testing for detecting and creating performance alerts
Datadog is an online network monitoring tool that helps users automate infrastructure monitoring, track application performance, minimize problem resolution time, and drive team collaboration.
This software allows you to build real-time interactive dashboards by using drag-and-drop graphs and widgets. These dashboards can display and analyze key performance metrics to help you monitor the health of your cloud infrastructure.
Datadog users can leverage synthetic testing (a technique to identify performance issues using scripted recordings of transactions) to track the performance of their application programming interface (API) from the back end to the front end and across various network levels. These tests use artificial intelligence (AI) to detect and create notification alerts for critical issues.
Log management is another important Datadog feature; it allows users to collect, manage, and analyze logs for troubleshooting and data analysis.
Datadog offers a mobile app for iOS and Android devices.

Key Features
- Alerts/escalation
- Anomaly detection
- Application security
- Audit trail
- Automated discovery
- Capacity analytics
Trial/Free Version
- Free Trial
- Free Version
Starting price
Support options
Device compatibility
Screenshots
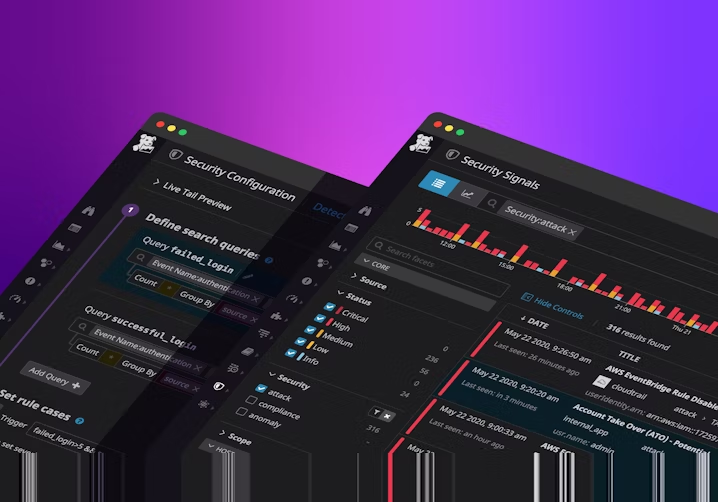
Viewing metrics, traces, and logs in Datadog (Source)
2. Google Analytics: Create up to 20 dashboards with 12 widgets each
Google Analytics is a cloud-based solution that offers reporting and analytics tools to enable data collection, visualization, and data analysis. This software helps enhance marketing performance campaigns by allowing users to track up to 200 metrics such as website traffic, goal completions, and user conversions.
Google Analytics' dashboards are a collection of widgets that facilitate data visualization. Users can customize their dashboards by including up to 12 widgets in a single dashboard. Overall, users can have up to 20 private dashboards in their Google Analytics account.
In addition to conversion tracking and traffic reporting, Google Analytics also provides keyword and third-party referrals to aid your website’s SEO strategy. This tool integrates with applications such as Google Ads, Optimize 360, Google AdSense, and Salesforce Marketing Cloud.
Google Analytics offers a mobile app for Android devices.
Key Features
- Conversion tracking
- Customer segmentation
- Data visualization
- Funnel analysis
- Pageview tracking
- Referral tracking
Trial/Free Version
- Free Trial
- Free Version
Starting price
Support options
Device compatibility
Screenshots
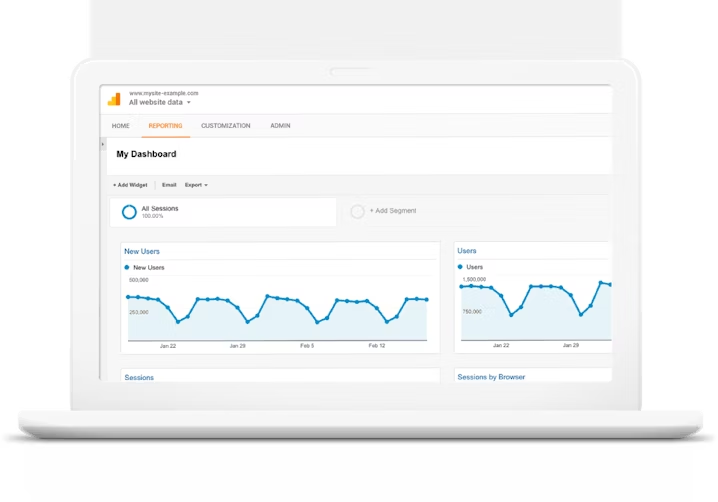
Dashboard view in Google Analytics (Source)
3. Matomo: Comes with approximately 100 widgets
Matomo is a free and open source web analytics platform that offers website heatmaps and session recordings.
This software allows users to create a customizable dashboard and configure widgets to gain insights related to interactions with their website. This software includes approximately 100 widgets by default that can be added via plug-ins.
As a Matomo user, you can track the performance of multiple websites on your dashboard. You can also optimize your websites by running an A/B test for landing pages to determine which works best.
Matomo offers automatic tracking of file downloads and optional tracking of 404 pages. It also allows users to visualize conversion funnels to understand visitor requirements and increase conversions of available traffic.

Key Features
- A/B testing
- Alerts/Notifications
- Behavioral analytics
- Campaign management
- Channel attribution
- Customizable dashboard
Trial/Free Version
- Free Trial
- Free Version
Starting price
Support options
Device compatibility
Screenshots
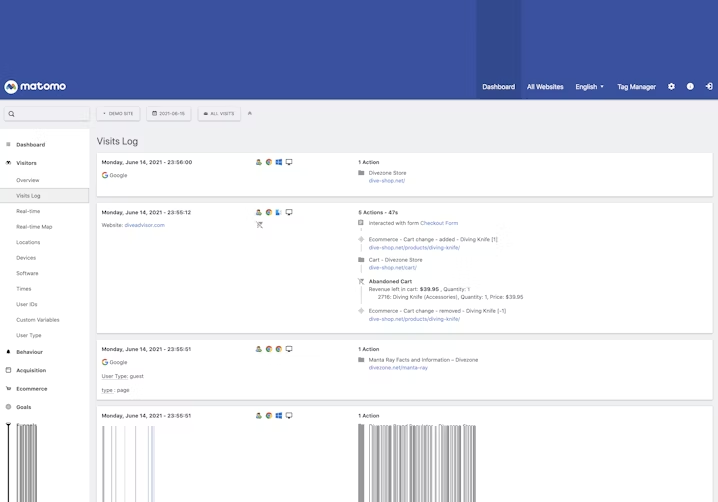
Visit log for individual user sessions in Matomo (Source)
4. Mode: Helps visualize up to 10GB of data
Mode is an online collaborative analytics platform that allows users to leverage business intelligence (BI) tools to import and analyze data from a range of database applications, including Amazon Aurora, Oracle, and MySQL. This tool allows data visualization in the form of charts, graphs, and pivot tables.
Mode users can build engaging dashboards and customize reports with a drag-and-drop tool. You can display these dashboards on televisions around your office. When displayed full screen, these dashboards automatically refresh to facilitate real-time analysis.
As a Mode user, you can share reports based on a specific schedule via email, Slack, or URLs.
Mode's data engine streams data from external databases and stores it to facilitate quick analysis. Known as Helix, this data engine offers visualization tools for post query exploration and allows users to explore up to 10GB of data.

Key Features
- Ad hoc reporting
- Application development
- Customizable dashboard
- Data connectors
- Data visualization
- Forecasting
Trial/Free Version
- Free Trial
- Free Version
Starting price
Support options
Device compatibility
Screenshots
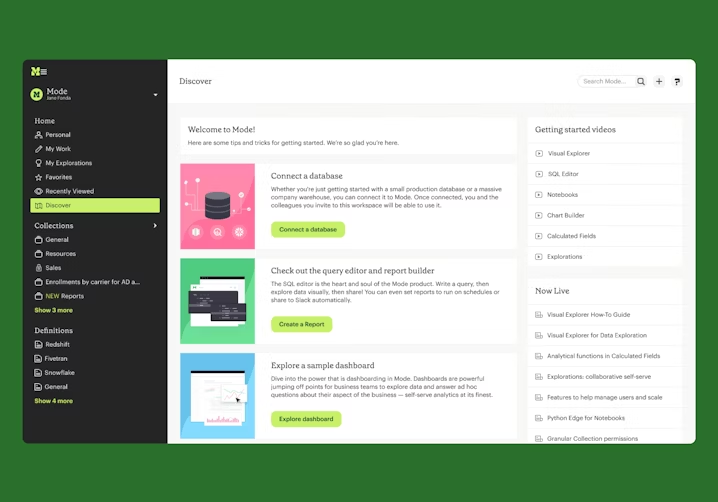
Dashboard view in Mode (Source)
5. Tableau: Offers no-code platform for dashboard customization
Tableau is data visualization software that helps simplify raw data and convert it into an understandable format. This software doesn’t require technical know-how or programming skills to operate, so even non-technical users can create custom dashboards and work on data, both structured and unstructured.
Tableau users can connect and import data from various external sources, including relational databases, Excel spreadsheets, and cloud data. This data can be further visualized in a variety of formats, ranging from charts and tables to diagrams, motion charts, and boxplots.
This software offers a drag-and-drop interface that allows users to add fields from the data pane to their tableau worksheet. It also provides a feature that enables users to interact with and seek solutions from professionals.
Tableau offers a mobile app for both Android and iOS devices.

Key Features
- AI/Machine learning
- Annotations
- Association discovery
- Behavioral analytics
- Benchmarking
- Collaboration tools
Trial/Free Version
- Free Trial
- Free Version
Starting price
Support options
Device compatibility
Screenshots
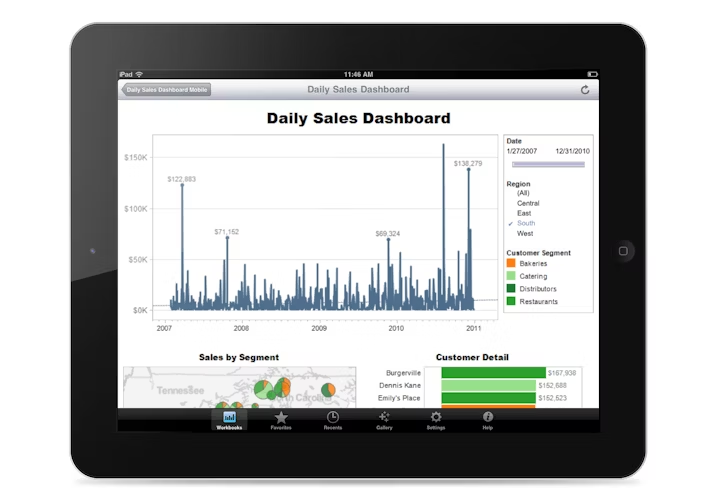
Daily sales dashboard in Tableau (Source)
How to choose the right free dashboard software?
Select a tool that meets your business requirements: Based on the size of your business and your employees' technical knowledge, your dashboard requirements are unique and can change over time. For example, businesses with less technical expertise looking for an overview of operational processes on a daily basis should consider operational dashboard software. Whatever your business requirements, be sure to research dashboard software options to ensure your needs are met.
Select software that offers real-time updates: Data is fundamental to every business and is constantly changing. These changes can even occur in large volumes over a short period of time. Look for dashboard software that provides real-time updates to facilitate accurate analysis. This ensures managers know what is going on at a glance and can also improve operational efficiency, help track the latest trends and patterns, identify issues, and facilitate quick decision making.
Select software that supports data sources used by your organization: Most dashboard software systems support various data sources, but it's important to ensure that the tool you select directly supports the data sources used by your business to ensure seamless data sharing between tools.
Common questions to ask when choosing free dashboard software
When selecting free dashboard software, it's important to ask software providers a few key questions:
Does your software offer multiple visualization options?
You may want to present your findings in a particular format due to certain project requirements. The software you select should support multiple types of graphs, charts, animations, and other visual delivery methods. Having varied data visualization options will help you design effective dashboards that are also easy to understand.
Does your tool require intense programming knowledge?
Dashboard tools should allow you to create customized dashboards without much hassle. A solution that is difficult to operate and understand in terms of technical requirements might require a programmer to facilitate dashboard creation and insight generation. Complex tools might also require additional training, which can significantly lower your return on investment (ROI).
Does the software provide a consistent view of important metrics without technical support?
Some dashboard tools are department-specific. However, any dashboard software solution you choose should provide an overview of all important metrics on a single screen. Even as a non-technical user, you should be able to explore your data sets and obtain a unified view of your KPIs without requiring dedicated technical support.
How did we choose these products? We didn’t—you did
To find your ideal software match, you need information you can trust so you can save time, stay on budget, and focus more energy on growing your business. It’s why we vet and verify all our user reviews and recommend only the tools endorsed by people like you.
In other words, our product recommendations are never bought or sold, or based on the opinion of a single individual—they’re chosen by your peers, reflecting the views and experiences of our independent base of software reviewers.