
A manager’s success depends on the tools they use. A simple working tool in the hands of a specialist can be the key to success. Like a scalpel for a surgeon, a screwdriver for a carpenter, a press release for a PR manager, or a monthly report for an accountant, the tools you use can build your business.

When talking about project managers, project management software featuring Gantt charts are the most striking and obvious example.
What is a Gantt сhart?
A Gantt chart is a bar chart used to visualize a project schedule with its milestones, details, and dependencies, all grouped according to the work breakdown structure (WBS) of a specific project.
A Gantt chart is a great tool used to show updated schedule status with vertical lines that represent actual dates.
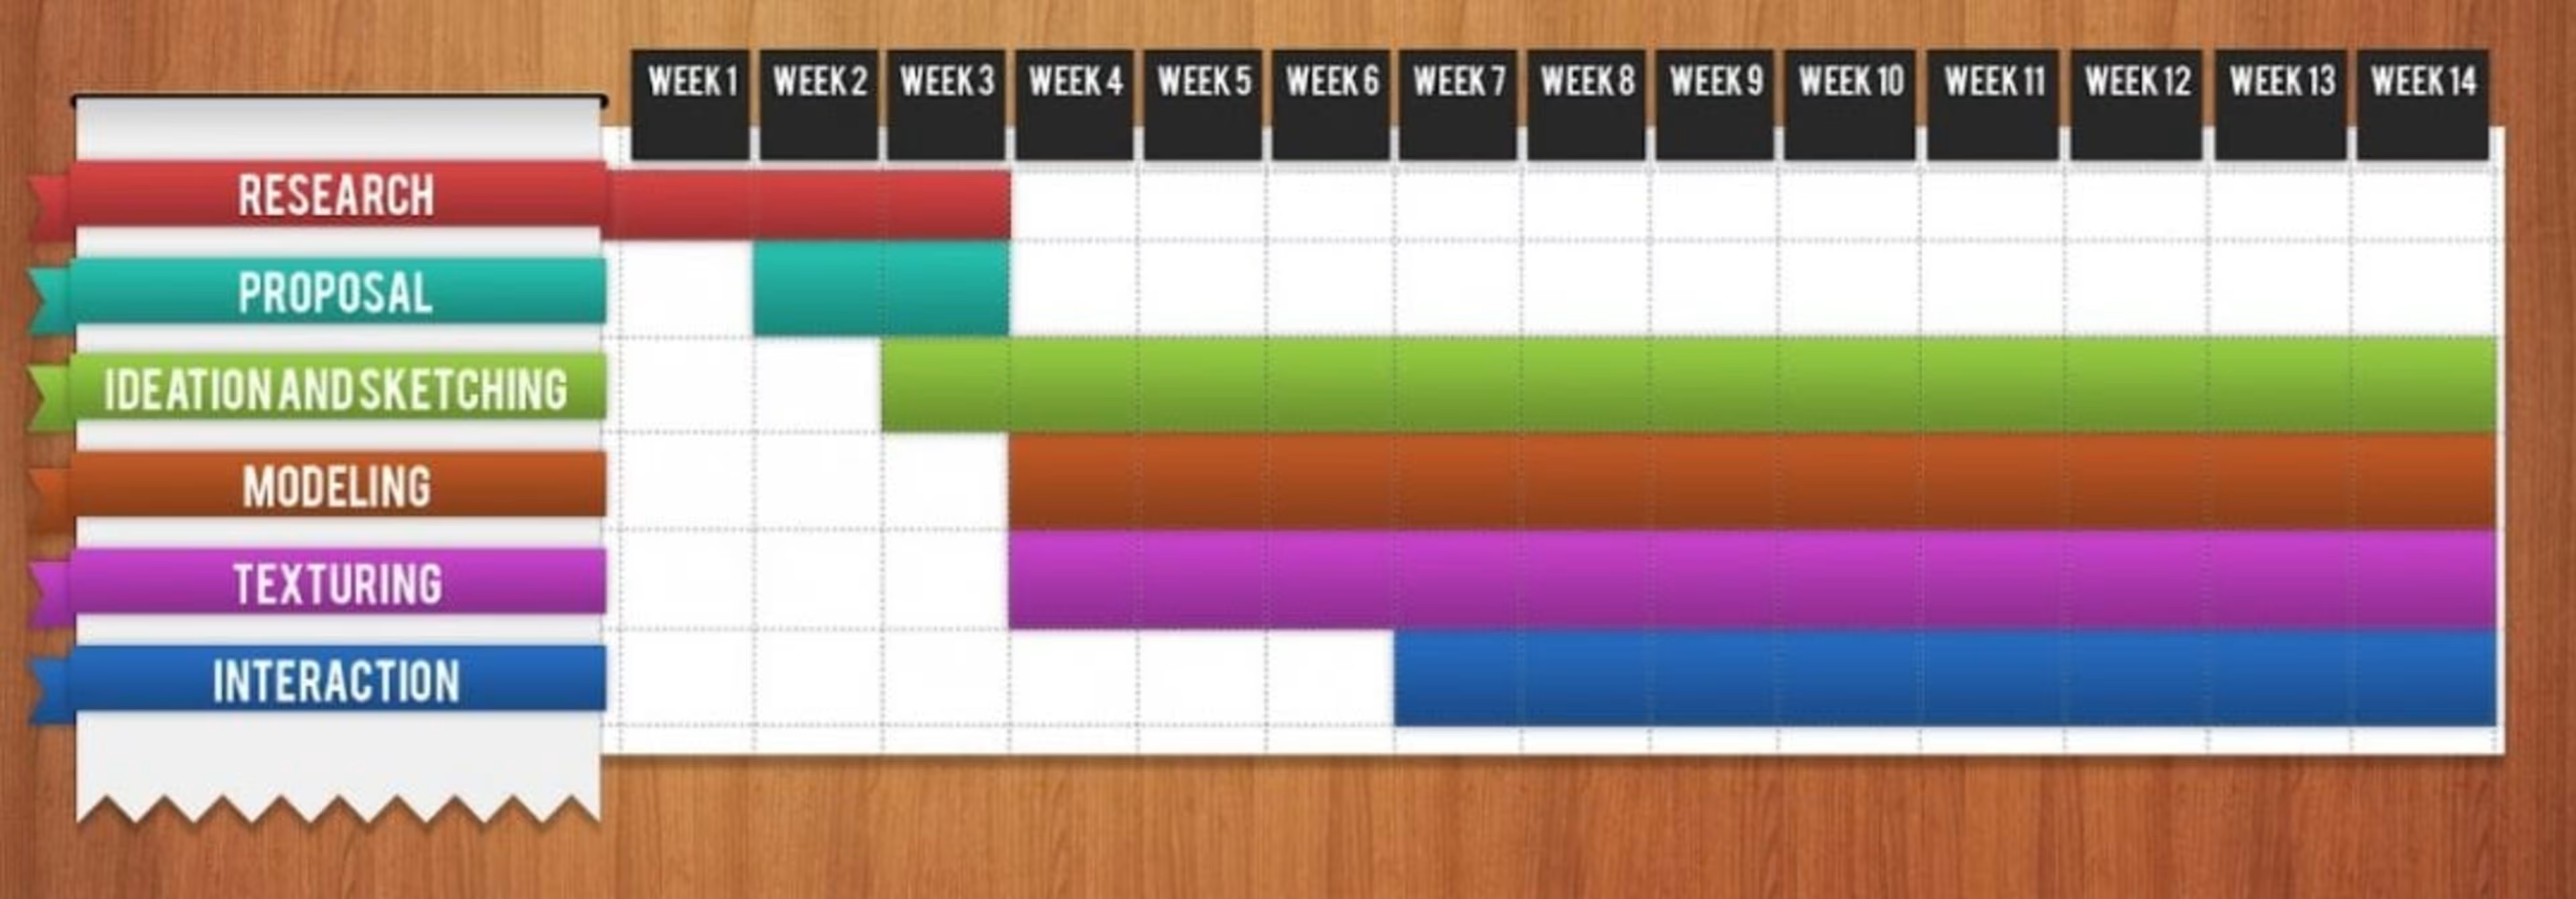
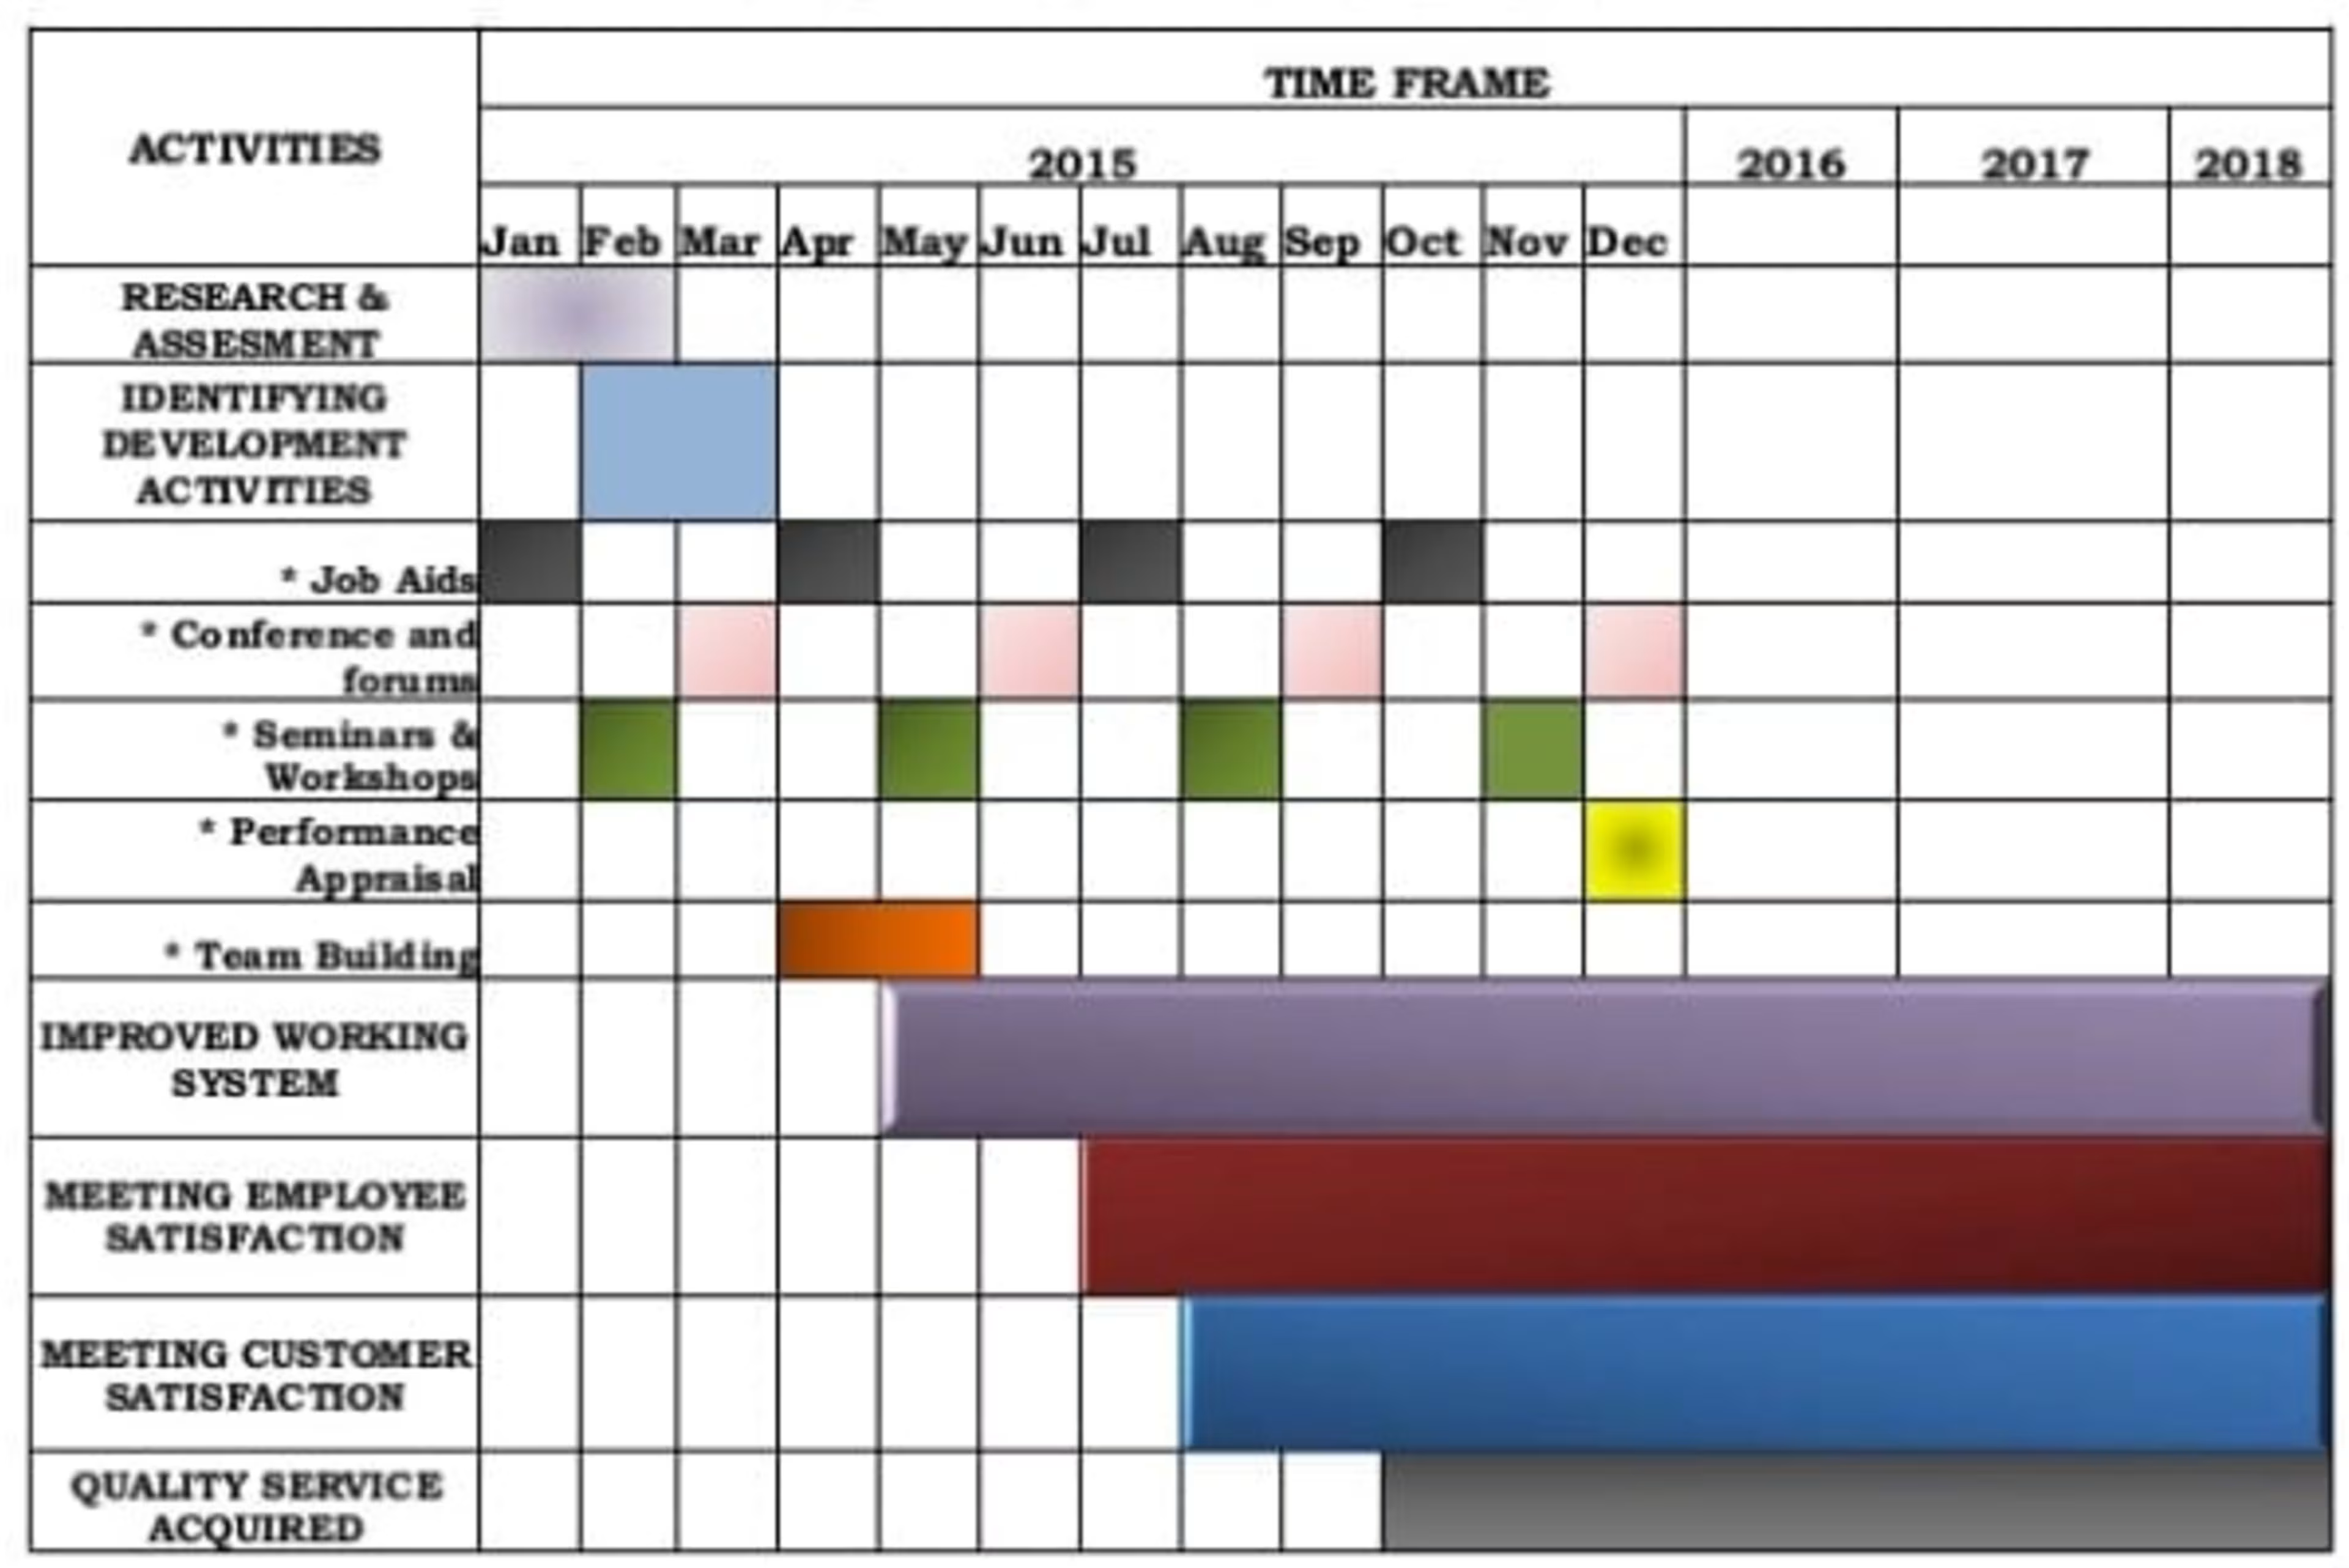
The example of Gantt Charts.
The main goal of every Gantt chart is to assess how long a project should take. Also it’s important to establish the order in which objectives need to be carried out.
Gantt charts have been around since 1910, and there’s a good reason for their longevity.
What makes Gantt charts so powerful for project management?
Gantt charts simplify task visualization and represent all stages and activities of a project
They help manage projects and reduce schedule problems
They help identify the critical points
The charts can be updated with software and apps
Gantt charts can be built even with Excel
5 tips on how to create Gantt charts quickly
You do not need any special tools to create Gantt charts. It’s easy to do so just using graph paper, and even easier with Gantt chart software. For now, let’s focus on manual entry:
To build up a Gantt chart, you should follow these steps:
Create a list of all your tasks. Highlight the earliest start date and the estimated duration for every task. If your tasks are sequential, define which stages they depend on.
Add graphs with the days or weeks through to objective completion.
Plot your objectives and tasks onto the graph paper. Add the tasks on the graph paper and show their earliest possible start date. Draw them as bars. Mark the time taken to complete them.
Prepare a schedule. It's time to apply a Gantt chart format by scheduling your tasks. Make sure your dependent activities do not start until the tasks they depend on have been completed. Gantt charts allow you not only to schedule your tasks. With their help, you are able to find out critical paths, apply work breakdown structure, or prioritize tasks with special methods. You can also share project objectives with your team members.
The final stage in this process is analysis. Prepare the final version of the Gantt chart that will show when you expect the project to be started and finished.
It looks easy, but it can take a lot of time. That's why you can use friendly and helpful project management software to solve this problem. For example, you can check out the multitude of online Gantt chart templates:
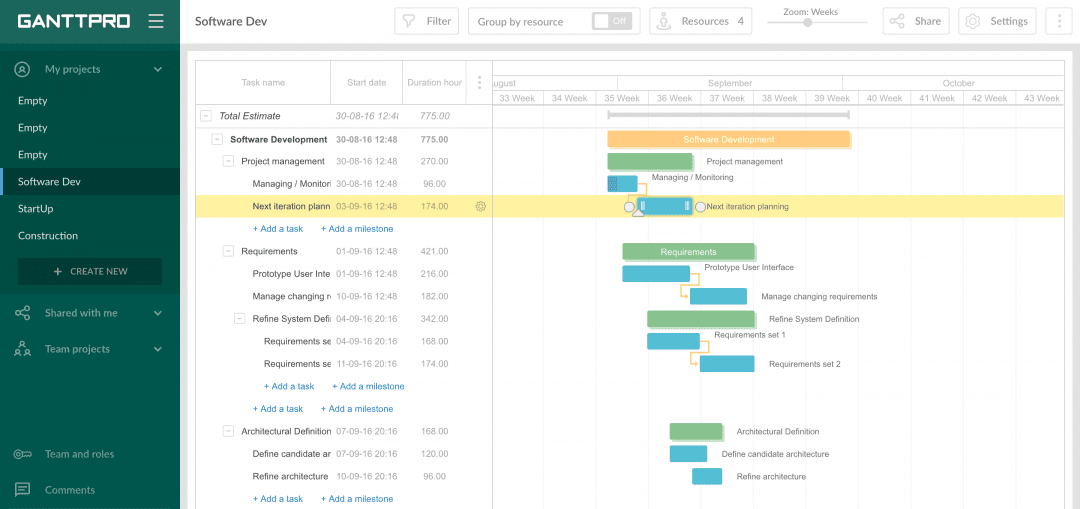
GanttPRO template.
As Gantt charts are simple and easy to construct, they can be used for almost any project. They can be applied in project planning and scheduling in different spheres. Let's have a look how the charts are implemented in construction, IT, marketing, finance, and education.
Gantt charts in construction
A Gantt chart for construction projects is an easy approach to project management. It can be a great tool for contractors, homeowners, building companies, or government agencies.
Engineers from all over the world consider Gantt charts a simple and easy-to-use project management tool. They can easily group all construction stages in the columns, edit the tasks, and customize them to their needs.
Keeping important people in the loop is a key point in construction project management. But is it easy to do?
First, you can share all your thoughts, tasks, and objectives with any team member
Secondly, people in your team can understand their roles and responsibilities. Everything is transparent
And finally, you can get feedback at any time and any stage of the project
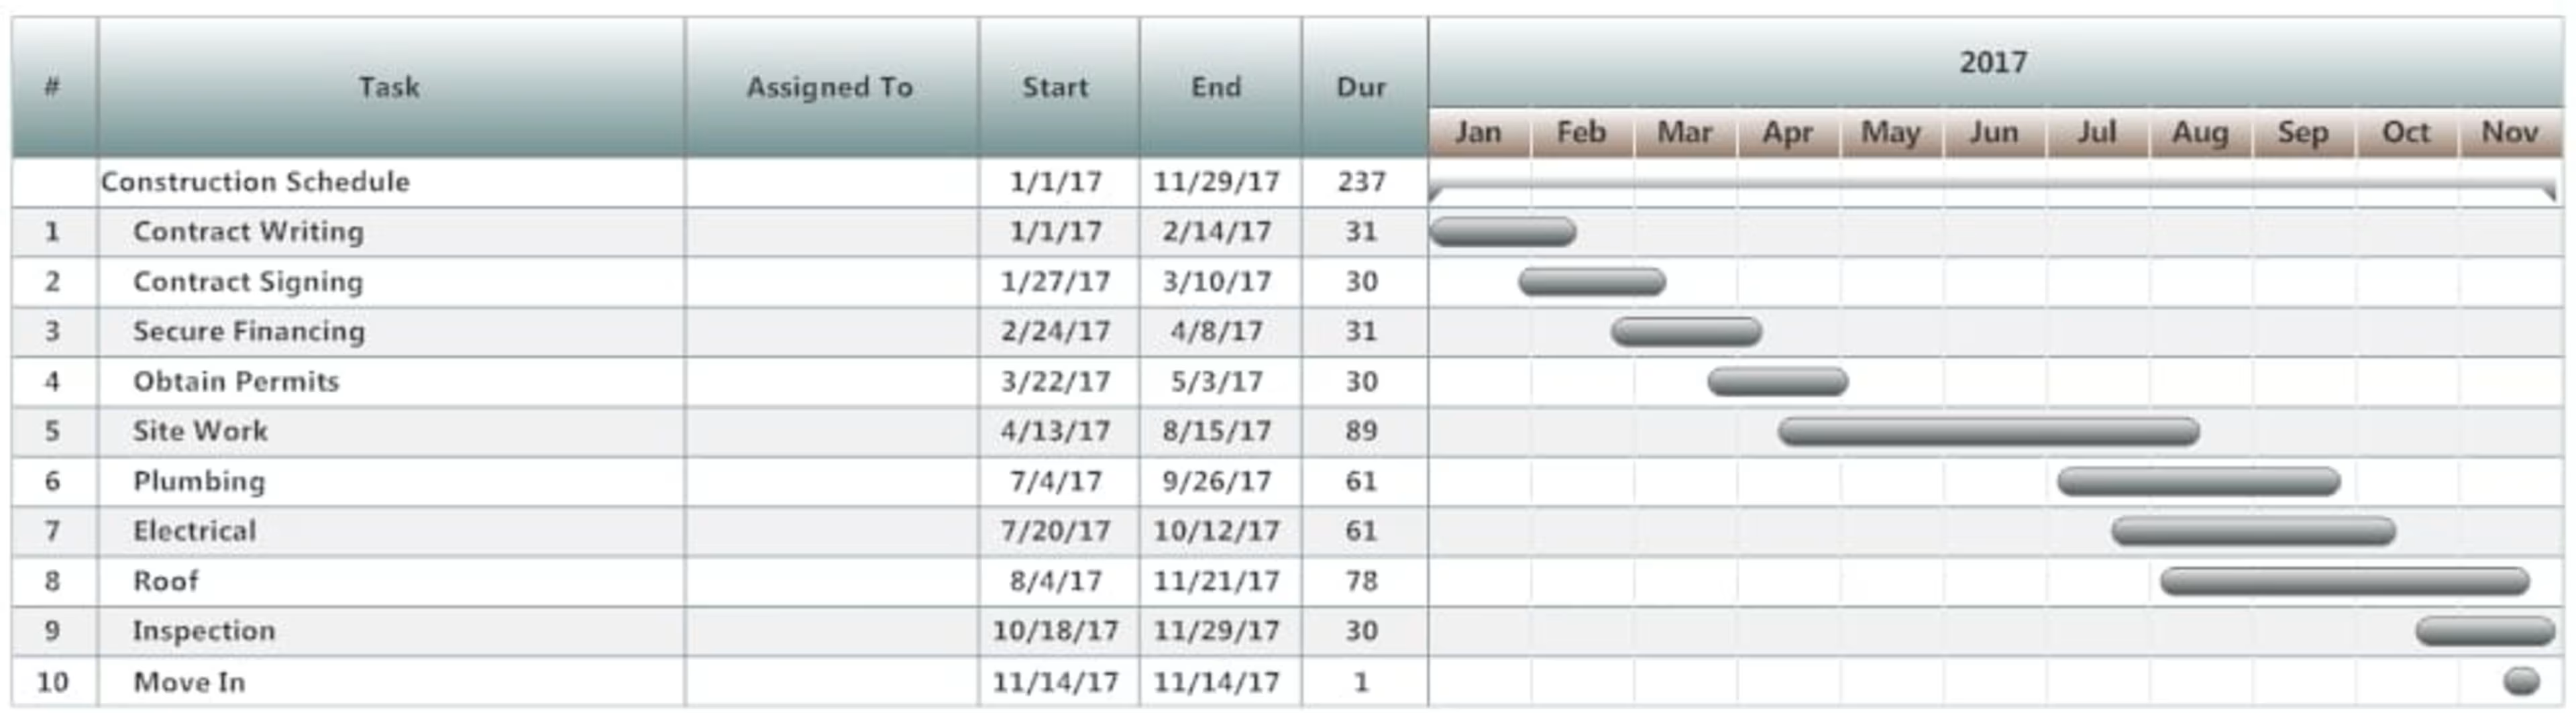
The example of construction project.
All stakeholders may track and comment on the schedule in real time. They can take part in the planning stages. If you want to visualize the project of building a garage using Gantt charts, you can easily determine the order of works, form relationship of tasks in the project schedule, and add all the works.
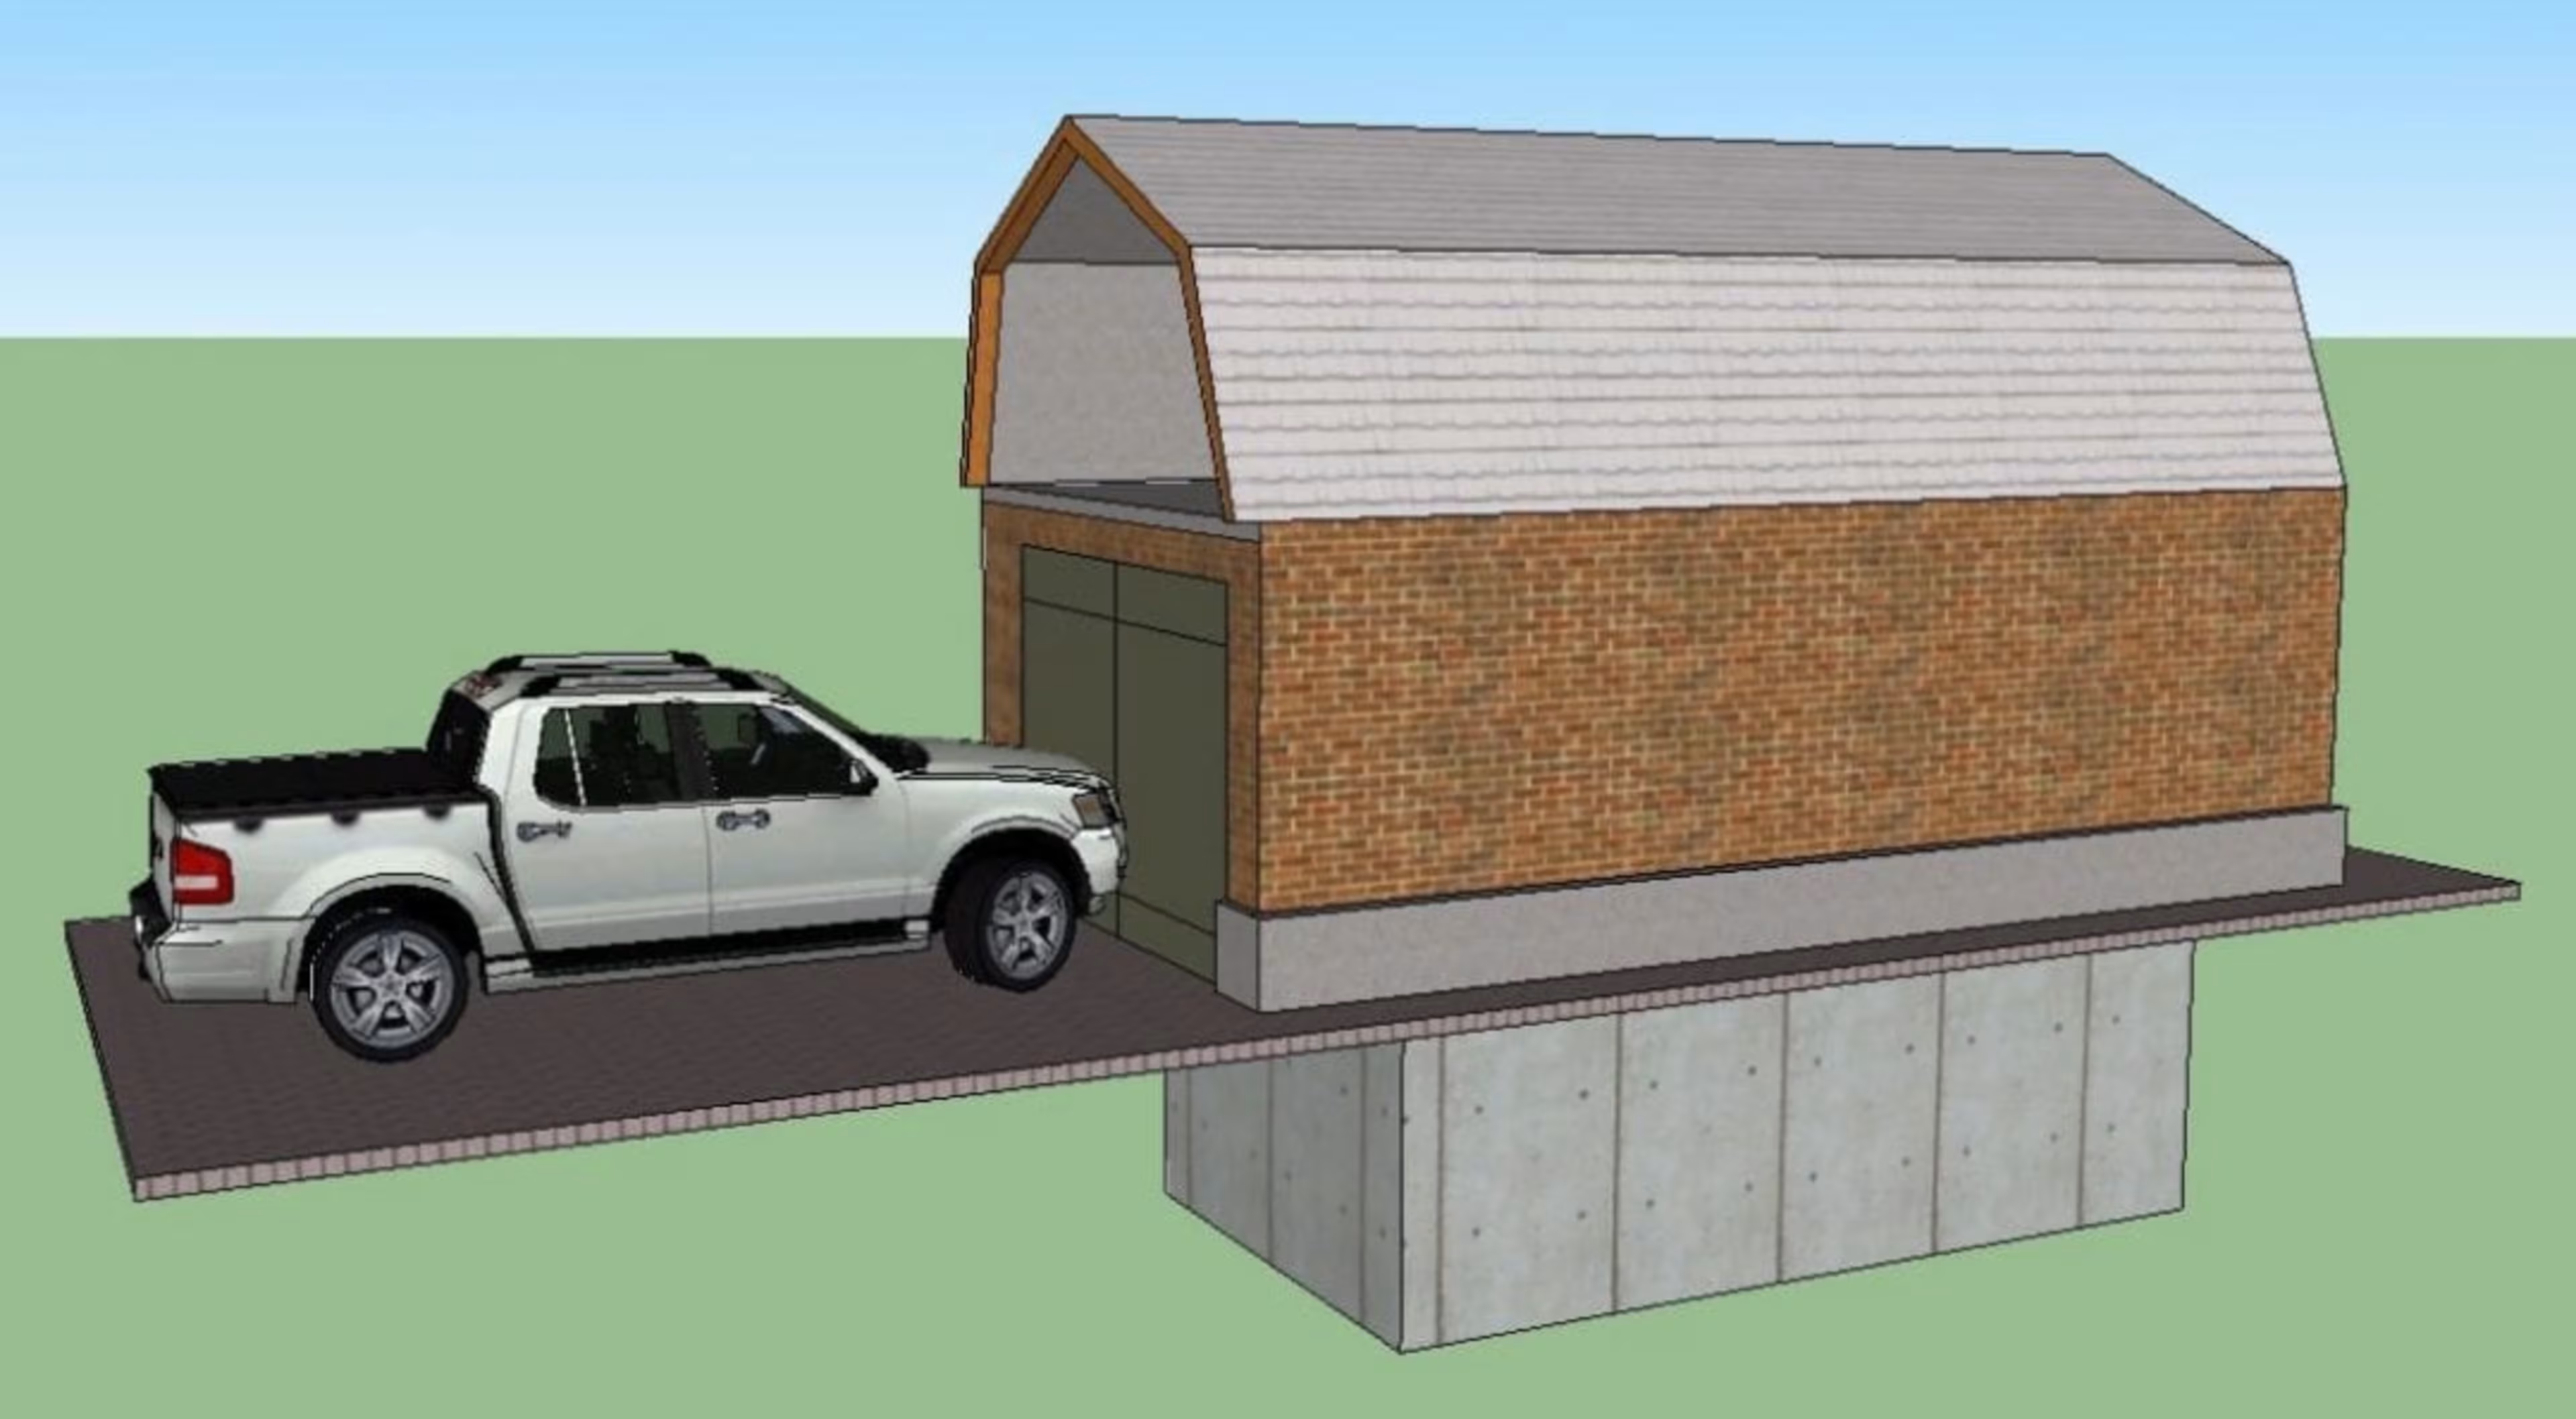
How to build a garage using Gantt Charts?
Here is the example of tasks for a hospital construction project and its visualization with a Gantt chart:
Select administrative and medical staff
Select site and do site survey
Select equipment
Prepare final construction plans and layout
Bring utilities to the site
Interview applicants and fill positions in nursing support staff, maintenance, and security
Buy and take delivery of equipment
Construct the hospital
Develop an information system
Install the equipment
Train nurses and support staff
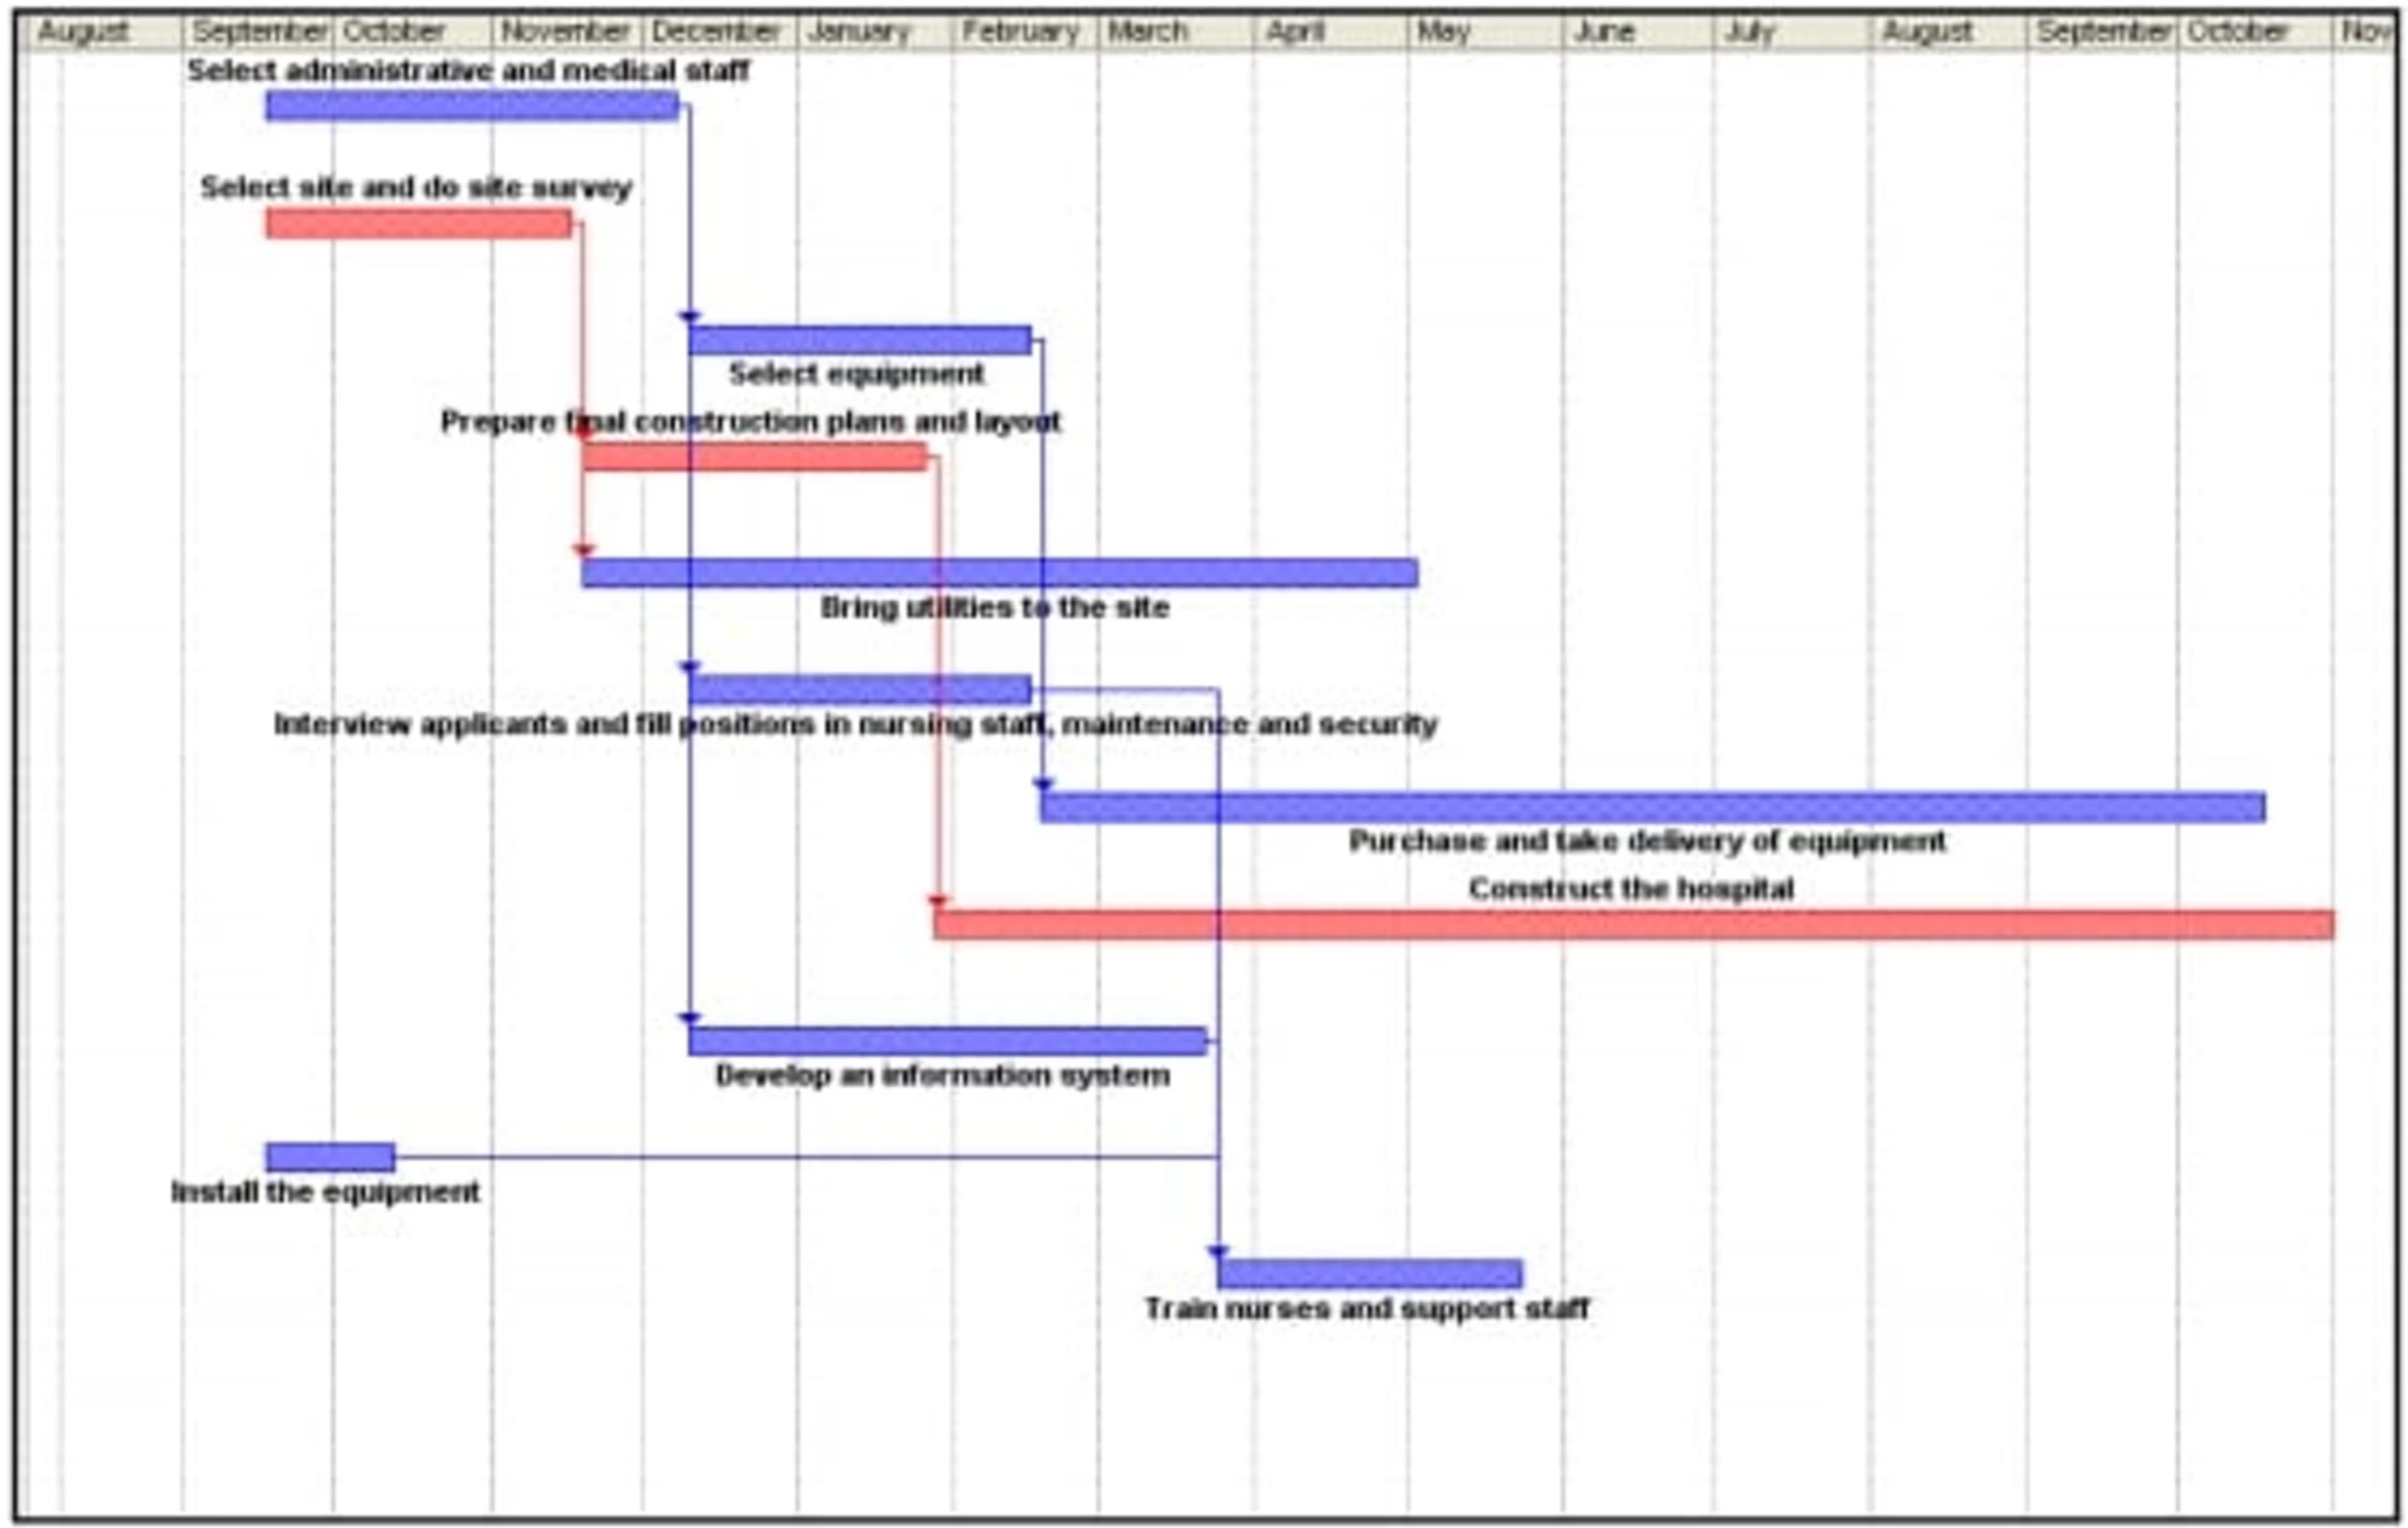
The example of the project with Gantt Charts.
Gantt charts in education
There are many software programs dedicated to project planning. For example, Microsoft Project and Excel are popular options. Students have access to these programs installed on their PCs in the IT labs and use Gantt charts for their educational projects.
In the educational process, it's quite convenient to represent history using Gantt charts. Gantt charts help to visualize history using a variety of bars and timelines and provide a tremendous amount of information.
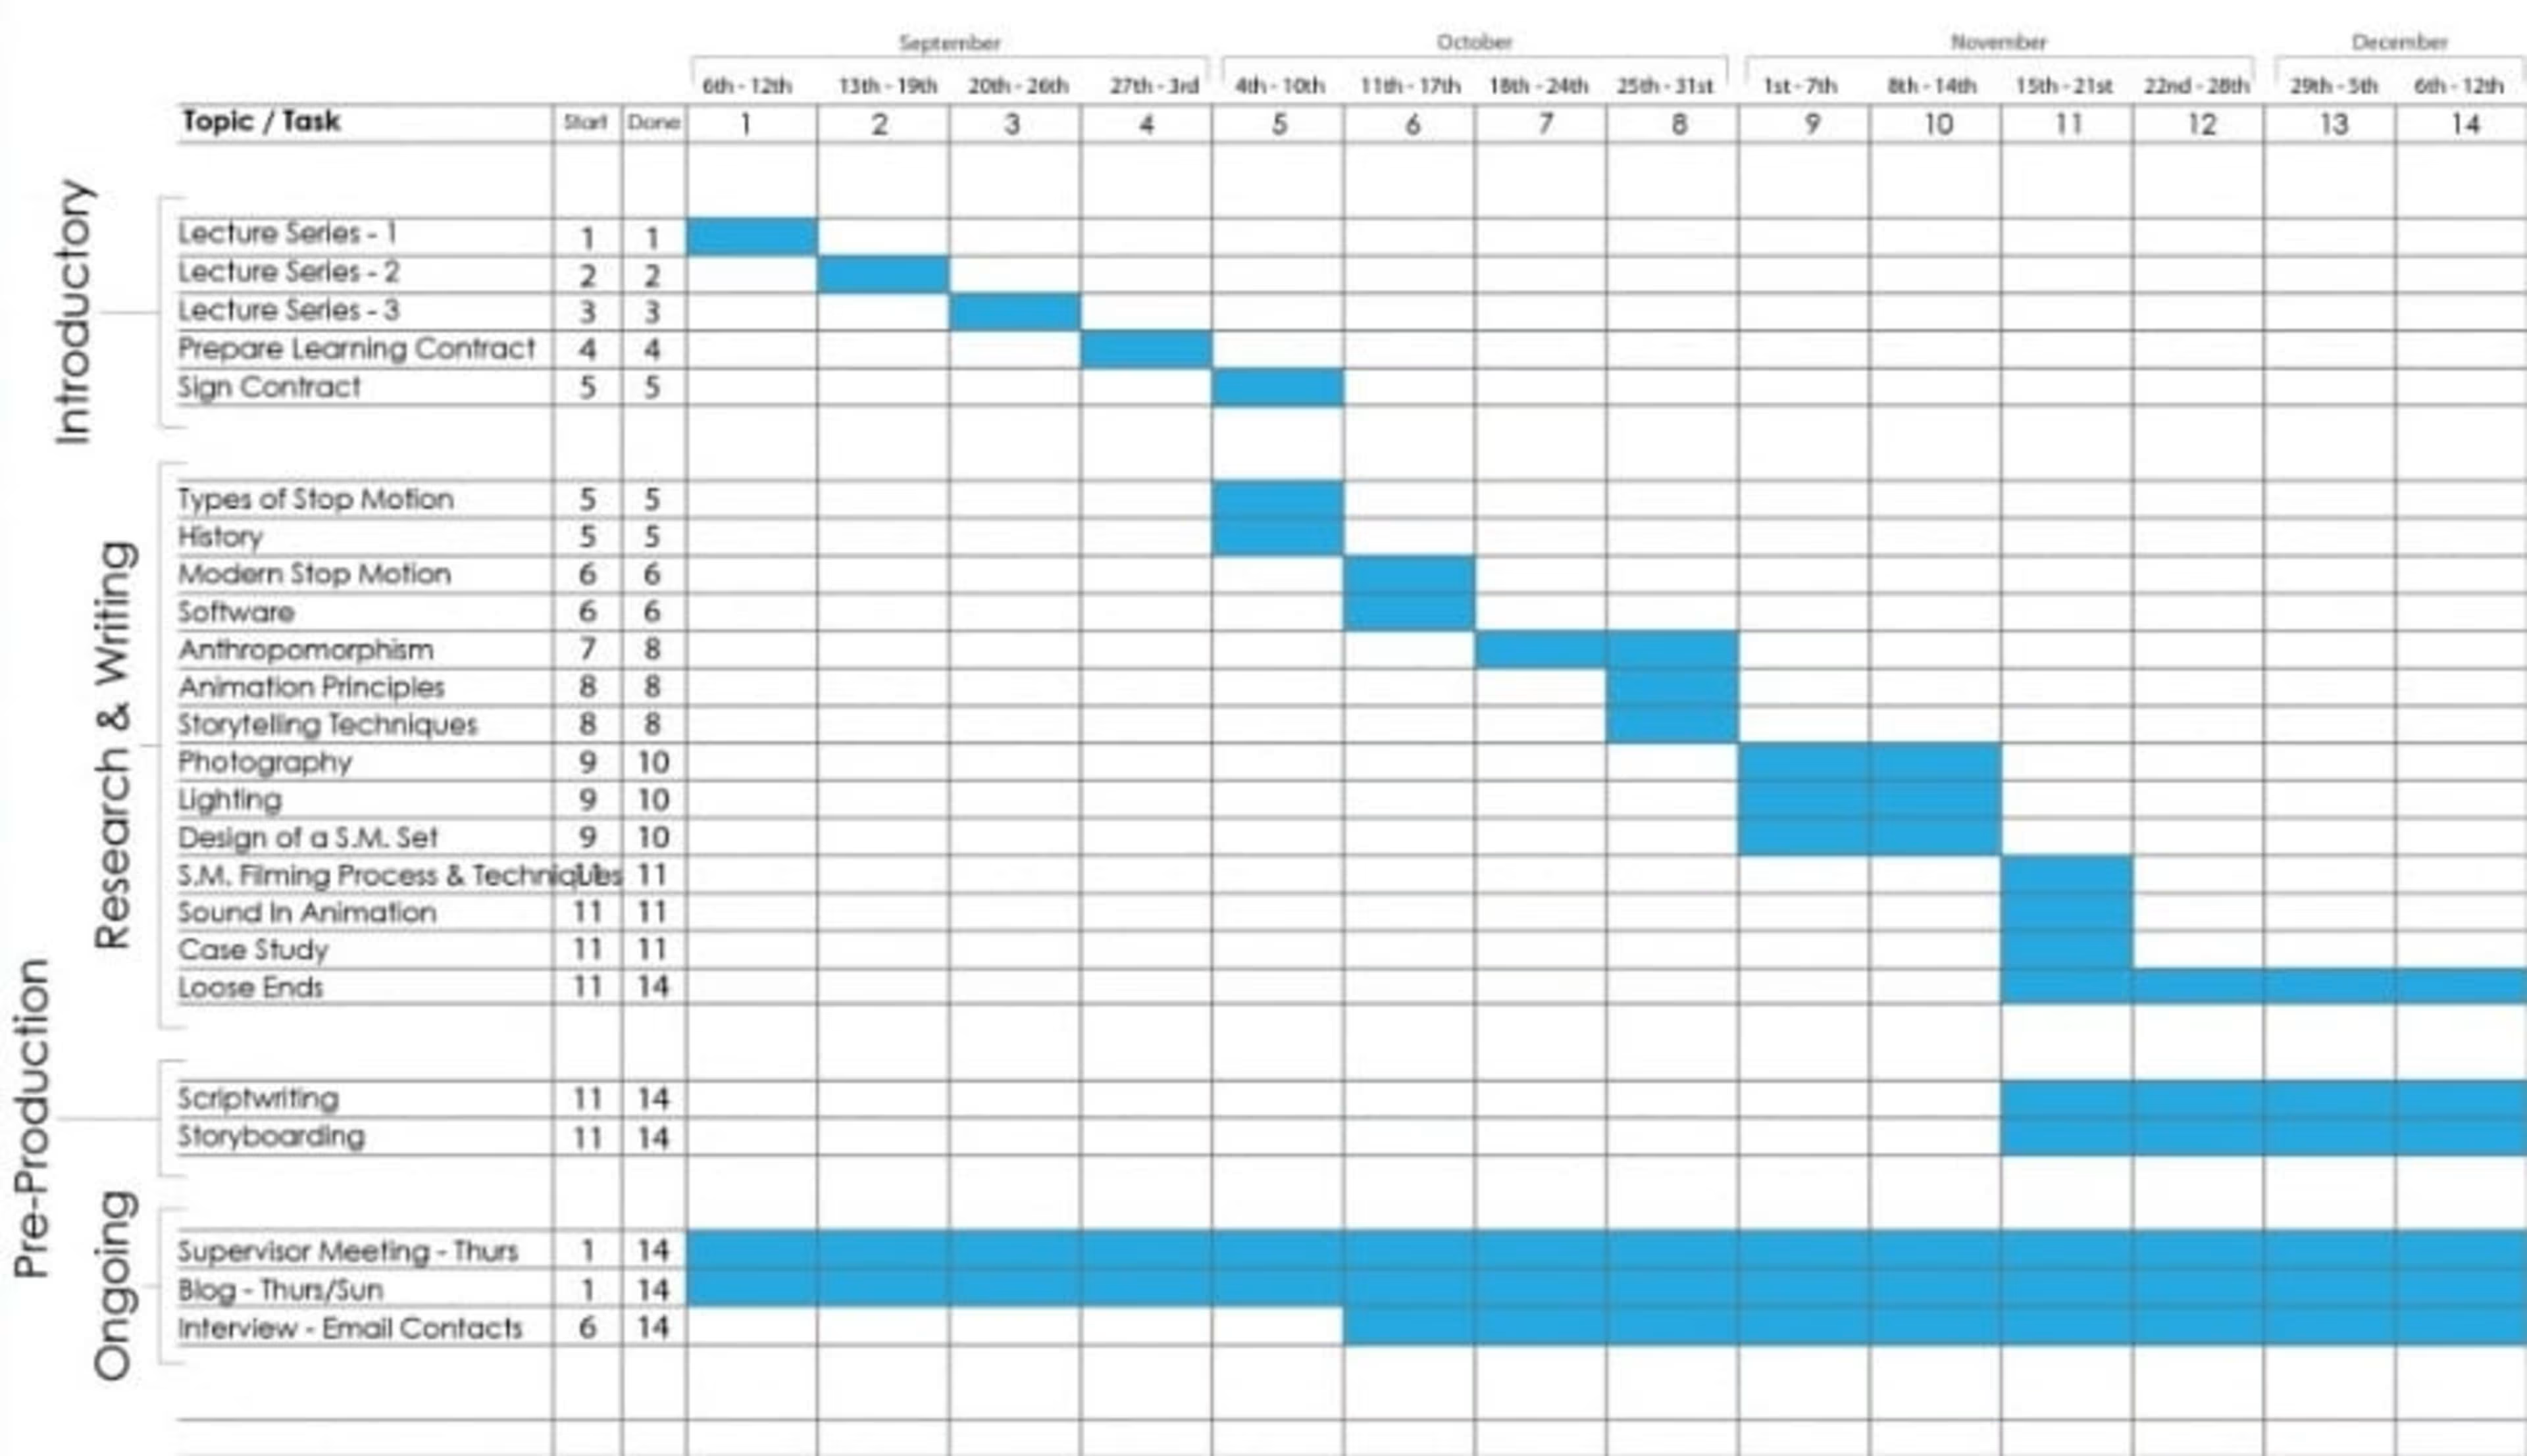
How to manage projects with Gantt Charts?
The psychology department of the University of Alberta celebrated its centennial in 2009. They compiled a list of its full-time faculty members for each year of its history with the help of Gantt charts. Everyone was able to examine the Gantt chart in a variety of different ways. The chart reflected simple descriptive statistics and departmental demographics.
The students could see the benefits of using Gantt charts and they began to use them in their projects and diplomas.
Gantt charts in IT
beas group , a solution partner for medium-sized manufacturing enterprises for more than 25 years, has also used Gantt charts.
The company has become an international SAP Solution partner. The beas group uses Gantt charts to compare scheduled activities and required resources. The visualization of projects creates a transparent reflection of complex structures with many dependencies.
Gantt Charts in IT sphere.
Gantt charts in marketing
Using Gantt charts, you can plan any marketing event. It's easy to do in Excel, but it visually begins to lose its popularity. It's better to try friendly and effective project management software for these aims.
Gantt charts let you apply different time scales for the different phases of a marketing event: days or even minutes. You won't get lost in the details at the beginning and will keep track of them when needed.
Marketing events can contain many last minute changes. It's not a problem to make changes in the schedule.
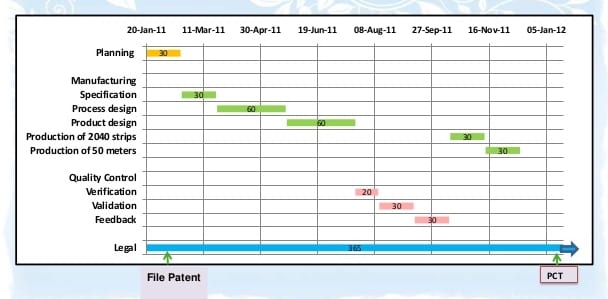
Check out the example of marketing project with Gantt charts:
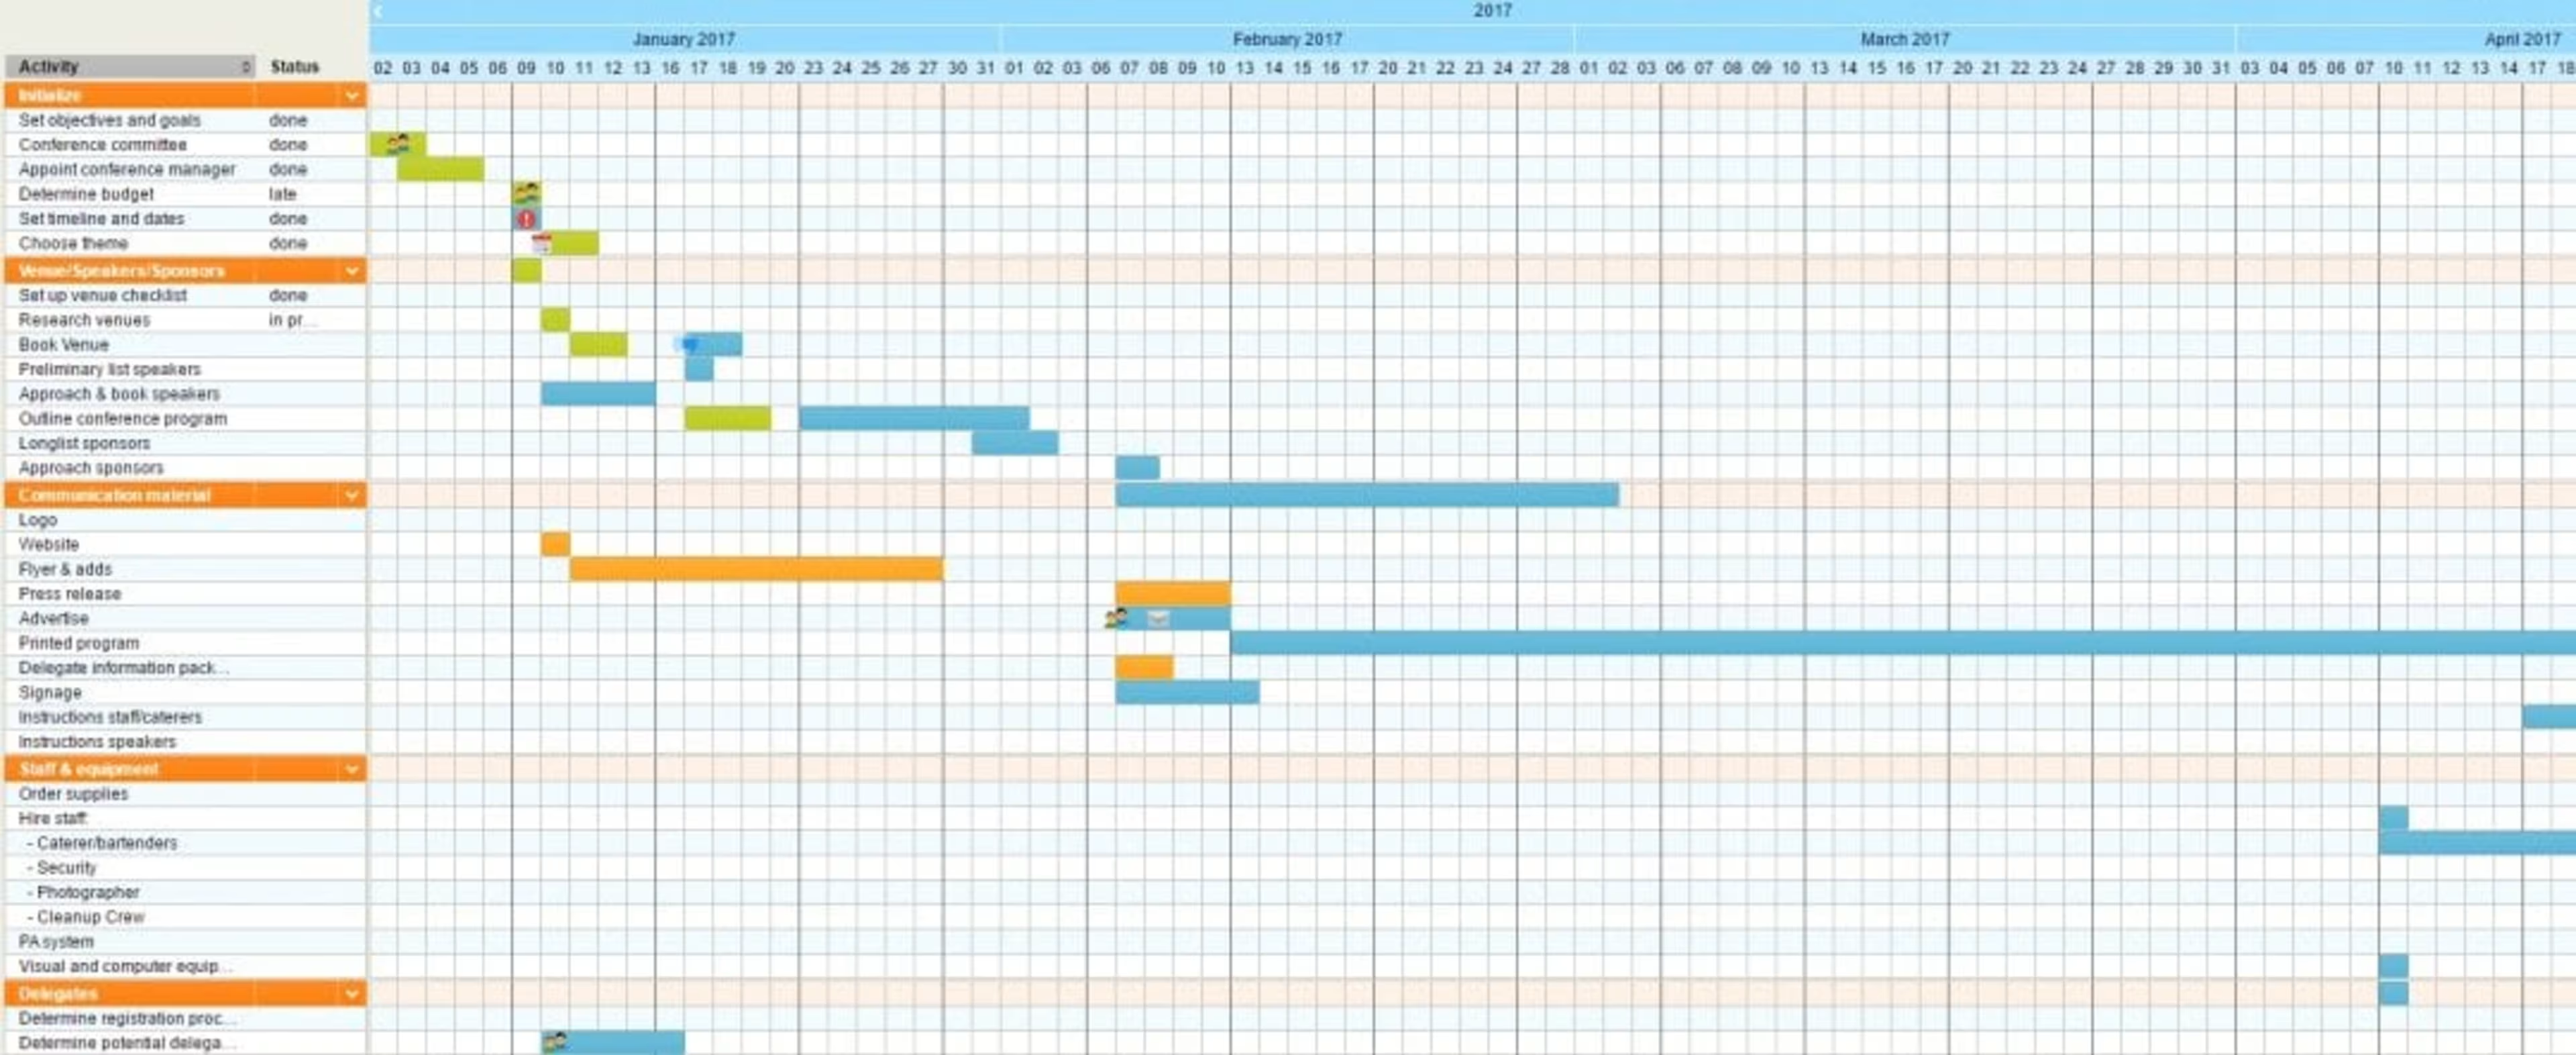
Gantt Charts in marketing projects.
Gantt charts in finance
One more area in which Gantt charts are used is related to financial institutions and banks.
Bank managers always try to organize all their tasks and plans. Gantt diagrams can be useful during the preparation of new banking products: loans, deposits, credit cards, etc. It's also a perfect tool to manage any marketing campaign in banks.
With the help of Gantt charts, you can also build up an effective contact center.
The First National Bank of Chicago, in its quality program presentation, used Gantt charts to visualize its progress and plans.
Gantt Charts in finance.
Gantt charts for everyone
Summing up these cases, results, and examples in different areas, it should be noted that Gantt charts can be used in any situation. Whether you want to build a swimming pool or plan a vacation program - Gantt charts will serve you as reliable and helpful assistants.
What do you think about Gantt charts and the spheres mentioned above? Feel free to add your feedback in the comments below!