
Reporting tools allow real-time access to essential data and rapid generation of multidimensional reports.
As a marketing, finance, or operations manager responsible for discovering insights from raw data to create performance reports, you know the challenges. Time-consuming report generation, lack of detailed reports, or the inability to collate multiple reports in spreadsheets are some of the common hiccups.
These challenges in your business reporting sound familiar? It might be time to invest in reporting software. The tool will help you streamline your reporting process from data collection to report generation. You can also share the gathered data or the final reports with other team members for instant access and clear communication.
However, investing in a technology tool can be expensive and if you don’t have a budget yet, it’s best to at least try it out for free. Lucky for you, there are free reporting tools available on the market to try your hand at its features before purchasing. This article highlights the three top free reporting tools (sorted alphabetically) based on user ratings and reviews. Read the complete methodology here.
Check out the full list of reporting tools in Capterra’s software directory.

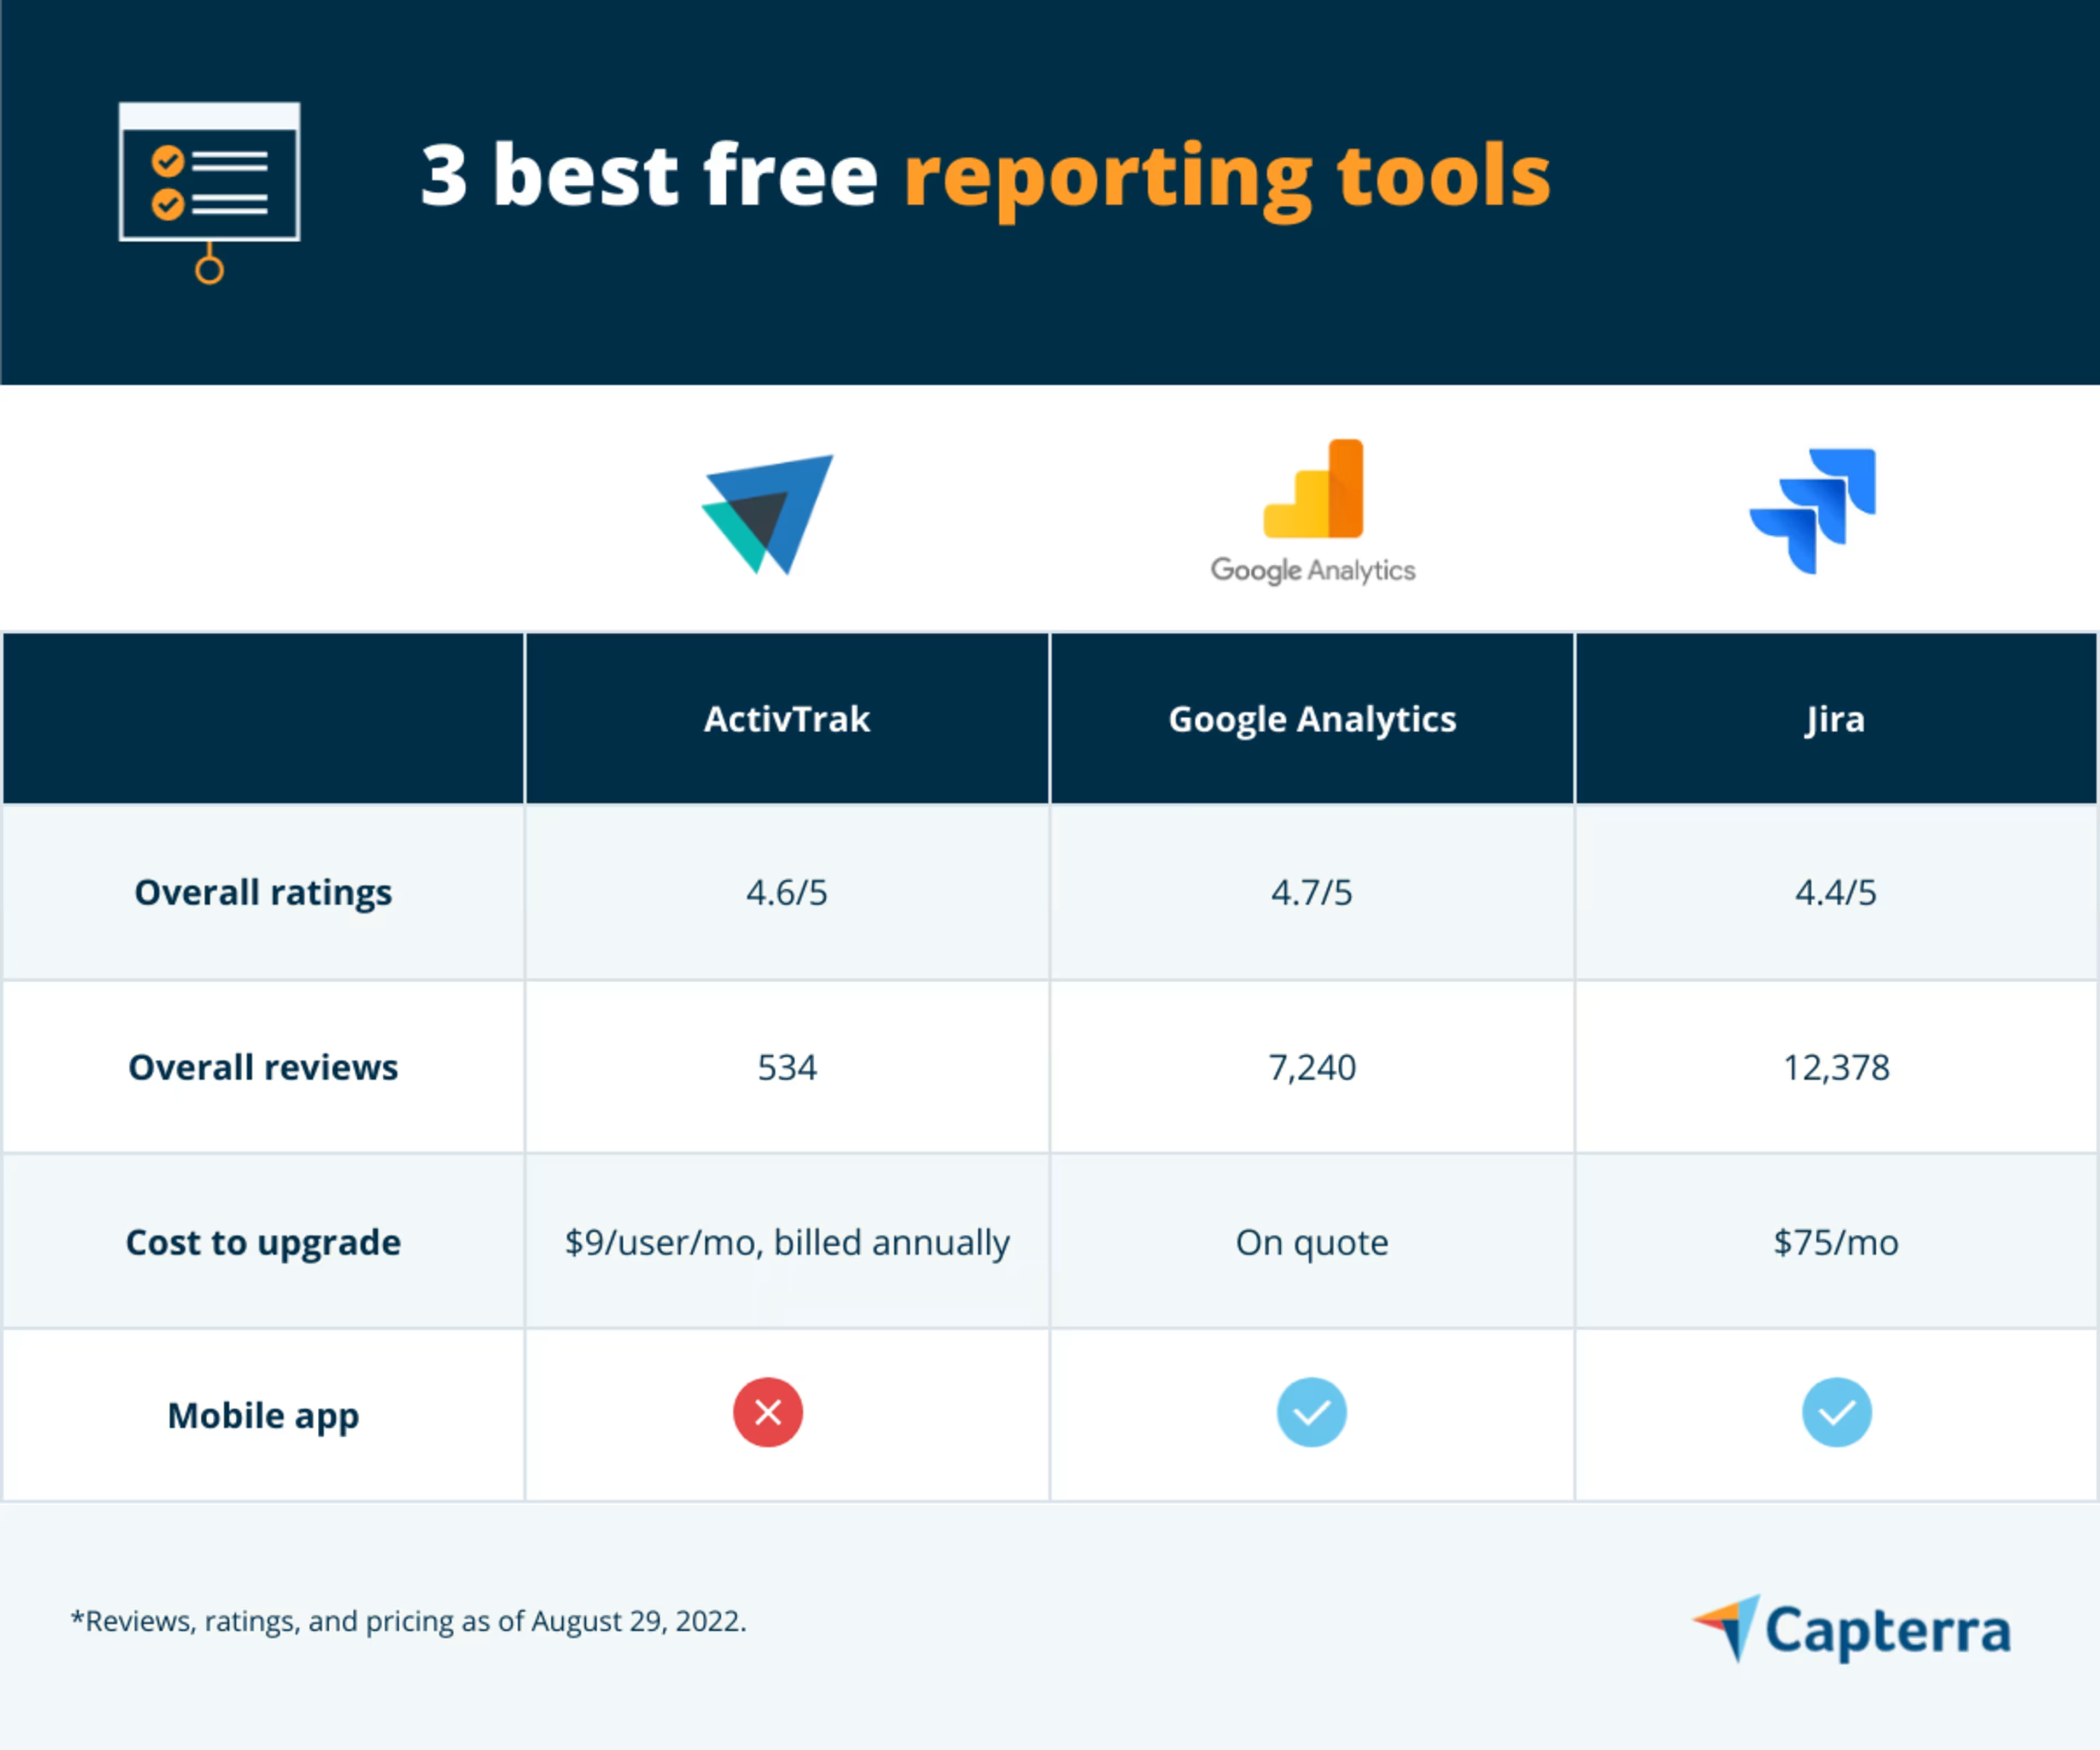
1. ActivTrak: Offers virtual agents to collect your business data
ActivTrak is a data reporting tool with a virtual agent (a coded mechanism) to collect all your business information and deliver actionable insights such as growth opportunities or new product launches. The agent collects data and executes responses to user activity while running in the background. All the information gathered from the analysis is stored and reported to the cloud storage when you’re offline. You will get alerts and can access the insights once you log in.
With ActivTrak, you can view and analyze the data insights delivered by the virtual agent in a graphical dashboard. The tool lets you build interactive reports, which can be further shared with clients and team members.
ActivTrak uses a multi-layered approach to encrypt your business data. The data is collected and shared using encrypted collection protocols such as Secure Sockets Layer (SSL) and multi-factor authentication.
For queries related to the software features, you can reach out to ActveTrak’s customer support team via email and phone call.

Key Features
- Activity dashboard
- Alerts and notifications
- Alarm-triggered screenshots
- Reporting and analytics
Trial/Free Version
- Free Trial
- Free Version
Cost to upgrade
Device compatibility
Screenshots
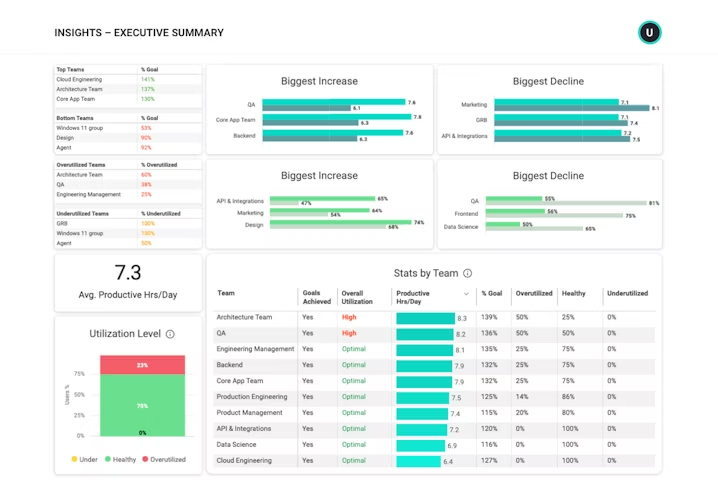
User Dashboard in ActivTrak
2. Google Analytics: Enables creating custom reports to map your customers’ journey
Google Analytics is a free reporting tool that helps you understand the customer journey on your website. You can customize your website analytics reports with metrics that match your business goals. You can even select specific marketing metrics such as acquisition, engagement, monetization, and retention to get the most accurate results that lead to efficient website optimization.
As a marketing data reporting tool, Google Analytics offers a template gallery with pre-designed reporting templates such as tables, charts, multi-step funnels, and tree graphs. You can select a template that best matches your report style, add your data, and download or share reports with clients and team members.
You can also use the Google Analytics dashboard to track the performance of your mobile application for traffic and engagement. The tool’s mobile device tracking feature creates a data filter that focuses on traffic from mobile devices, helping you understand if your website is user-friendly across mobile devices.
Google Analytics has a mobile application for Android and iOS devices that lets you track traffic on multiple digital assets on the go. For queries related to the tool features, you can reach out to the support team via email or live chat.
Key Features
- Activity dashboard
- Predictive capabilities
- Reporting and analytics
- Tag management support
Trial/Free Version
- Free Trial
- Free Version
Cost to upgrade
Device compatibility
Screenshots
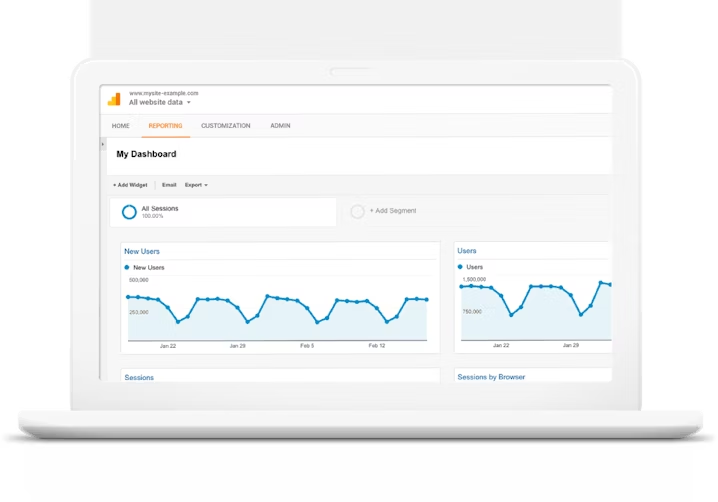
Website traffic analysis in Google Analytics
3. Jira: Provides a customized Kanban board to streamline workflow
Jira reporting tool is designed to help businesses streamline their workflow for maximum efficiency. You can use the tool to build customized Kanban boards for your team to update and track project progress. Set up your Kanban board with one of the default workflows available and start adding your tasks. As your team and work progresses, you’re able to update the workflow as needed.
You can hover over each task on the Kanban board to check details such as project types and due dates. Double-click on the task if you need any additional information about the project such as the name of other team members or the data source related to the project.
Jira has a mobile application for Android and iOS devices to prioritize work, resolve requests, capture tasks, and more on the go. For technical support, you can reach out to the customer service team via email or call.

Key Features
- Agile reporting
- Backlog
- Customized workflows
- Scrum and Kanban boards
Trial/Free Version
- Free Trial
- Free Version
Cost to upgrade
Device compatibility
Screenshots
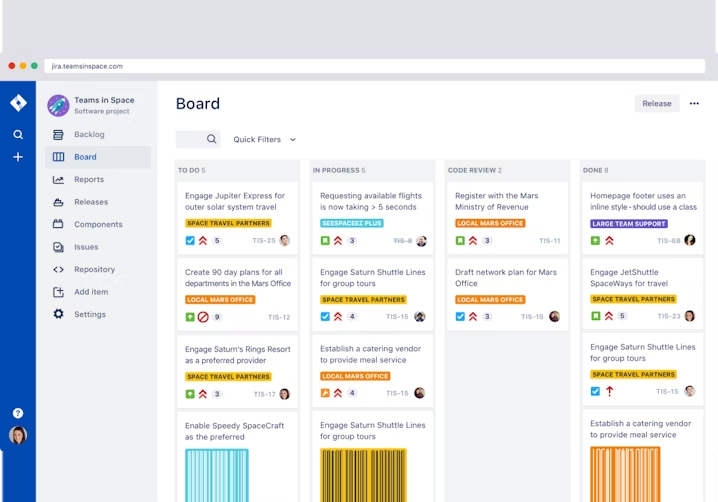
Kanban board in Jira
How to choose the right free reporting tool
Here’s a list of key considerations when selecting the best reporting tool.
Assess the report customization feature: An ideal reporting software should let you customize your reports based on the specific performance metrics that match your current business needs or strategies. Check the extent to which you can customize your report with the selected reporting tool before signing the purchase deal.
Look for data visualization options: Reports with alpha-numeric values can be critical to understanding therefore, you need to present them simply and interactively. Most reporting tools offer visualization options such as graphs and charts to present your reports. Check the available data visualization options with your selected reporting tool and also analyze if they are a perfect fit for the kind of reports you create.
Check for real-time updates: Real-time access to data insights is crucial in reporting to make informed business decisions. Assess the availability of real-time information updates with your selected software tool. Also, check if the tool allows you to set alerts and notifications for changes in the set performance metrics or project progress.
Common questions to ask while selecting free reporting tools
You can ask your shortlisted software providers the following questions to make an informed decision when vetting free data reporting software tools.
Does the tool enable integration with data management applications?
You should be able to directly export the data from your data management applications such as Excel to the reporting software. This saves you a lot of time manually entering the data into the tool for analysis. Ask about the integration feature as some software vendors facilitate direct API integration while others offer their suite solutions.
How to share created reports with clients and team members?
You should be able to download and share the created reports and analytics dashboard with clients and team members to keep them updated on the performance and progress. In addition, the stakeholders should be able to comment on the reports or dashboard or share their feedback in chat without having to switch between multiple applications. Ask the software vendor about the report sharing feature and other collaboration tools available with your chosen reporting tool.
Does the tool allow modifying pre-designed report templates?
Most reporting tools offer pre-designed templates to add your data such as graphs, charts, tree diagrams, and more. However, not all tools, especially the free version, let you modify the existing templates. Ask the software vendor if you can modify the pre-designed report templates and if yes, which elements can be modified?
How did we choose these products? We didn’t—you did
To find your ideal software match, you need information you can trust—so you can save time, stay on budget, and focus more energy on growing your business. It’s why we vet and verify all our user reviews and recommend only the tools endorsed by people such as you.
In other words, our product recommendations are never bought or sold, or based on the opinion of a single individual—they’re chosen by your peers, reflecting the views and experiences of our independent base of software reviewers.