
You want to use business intelligence software. You've heard that it can save your business money and turn your headache-inducing Excel spreadsheets into sources of value.
If you're like me, however, you're intimidated by the business intelligence buzzwords that surround it. The sales speak from software vendors and the buzzword-laden journalism from industry publications can be intimidating to BI newbies.
According to a recent Gartner survey*, only 47% of American small businesses use business intelligence software. This is a result of that buzzword barrier—which you need to break through if you want to shop smart for business intelligence software.
Compare the business intelligence buzzword barrier to the one surrounding a sport such as baseball. If you don't even know what a strike is, listening to seasoned baseball fans discuss framing pitches and wins above replacement will most likely scare you away. If you learn what the buzzwords mean, however, the jock jargon becomes comprehensible.
Fortunately for you, the same is true for business intelligence software. Figure out what the buzzwords actually mean, and the benefits beneath them are revealed.

In this post:
I'll share nine of the most-used business intelligence buzzwords and phrases and translate them into plain English.
I'll explain how these buzzwords can confuse your software search.
I'll share how you can get past the buzzword barrier and understand what business intelligence software can do for you.
1. Business intelligence
To adapt Bill Cabiró's definition of business intelligence, BI is getting the right information to the right people at the right time, so they can make the right decisions.
That idea's at the heart of all the ways "business intelligence" is used. (And it's used a lot: If words are silly putty, the phrase "business intelligence" has been used so often that it's stretched to see-through.)
Pretty much any data can be business intelligence, as long as you know how to use it.
How the buzzword causes confusion
Business intelligence is any helpful insight you get from the data you collect. And getting insights isn't dependent on software, but it is helped (tremendously) by it.
Even if you don't have "business intelligence" (the software), you can get business intelligence (the idea) by looking at a spreadsheet, or noticing something as simple as a correlation between an email campaign and a spike in sales.
Don't miss out on that chance to think in terms of business intelligence, even if you don't have a BI software program yet. In fact, if you learn how to think in terms of business intelligence now, you'll be better prepared to use the software once you purchase it.
Many small businesses already collect enough data to make business intelligence software a worthwhile investment.
For instance, looking for intelligence in thousands of rows in an Excel spreadsheet overwhelms most people. The more complex the analysis gets, the less Excel spreadsheets will help. Comparing multiple variables is frustrating and grueling in an Excel spreadsheet. It's comparatively simple with a BI tool.
In just a few clicks, BI software can turn this...
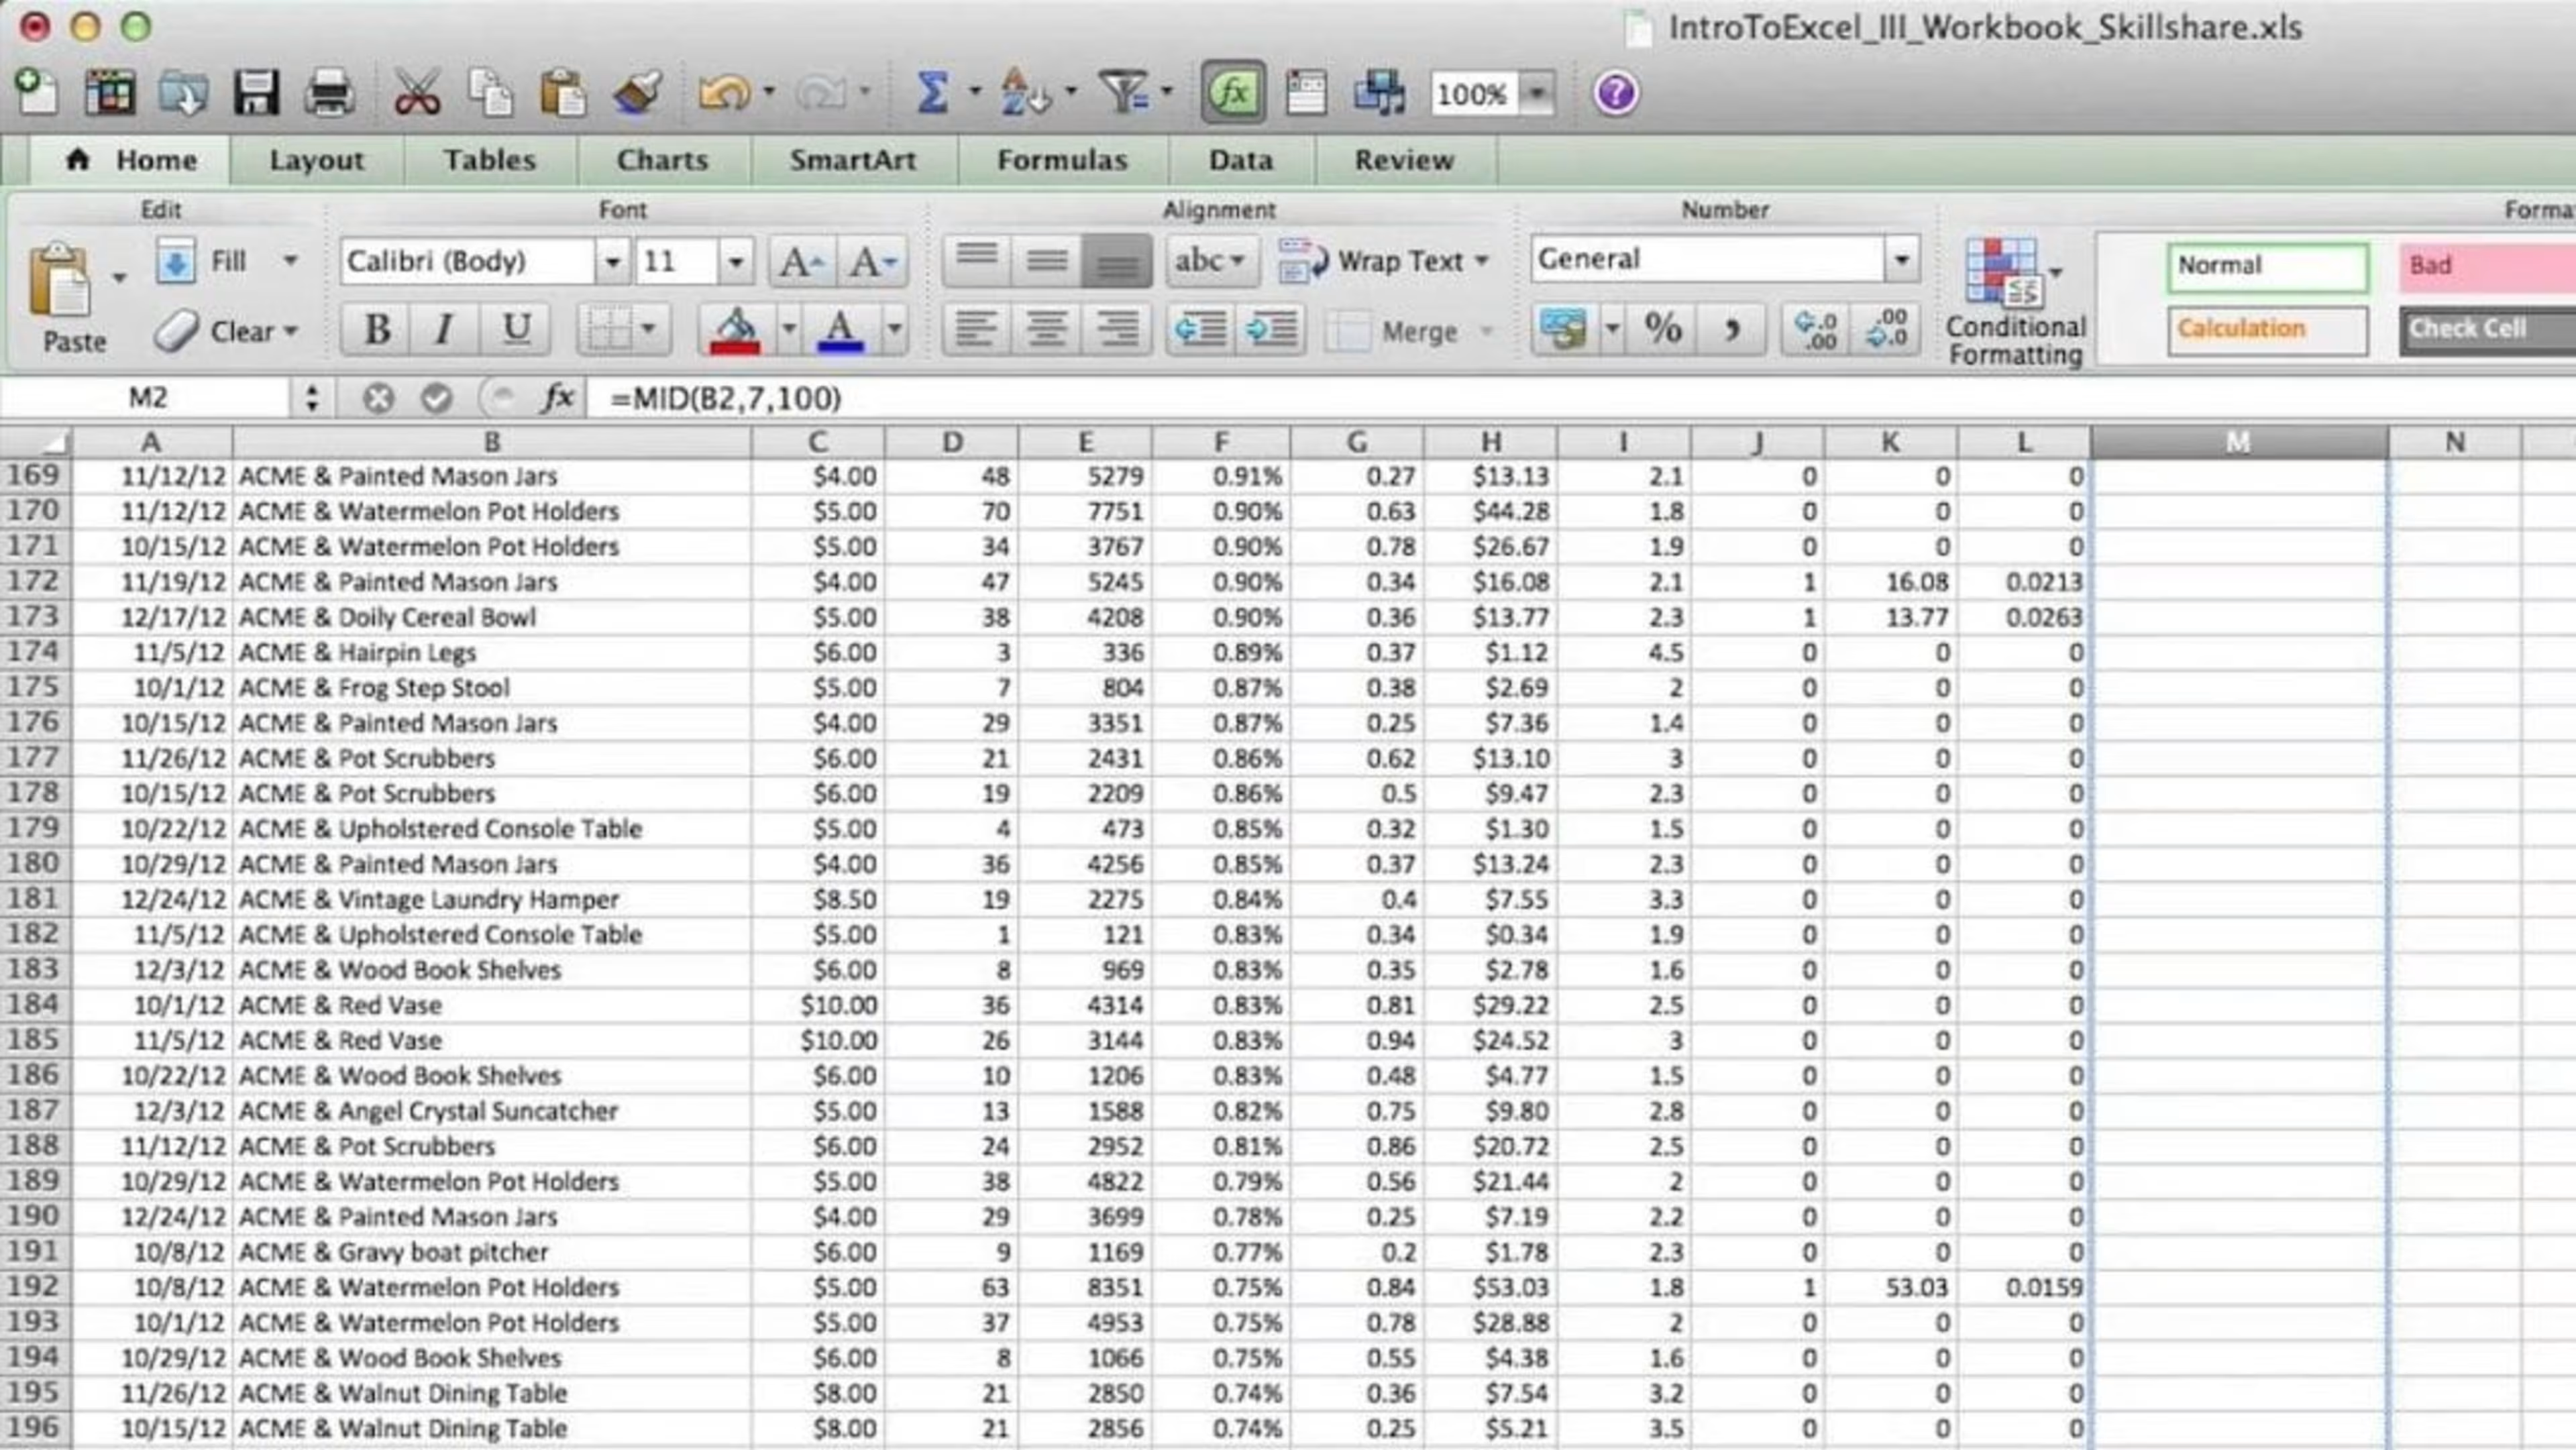
An Excel spreadsheet (Source)
into this.
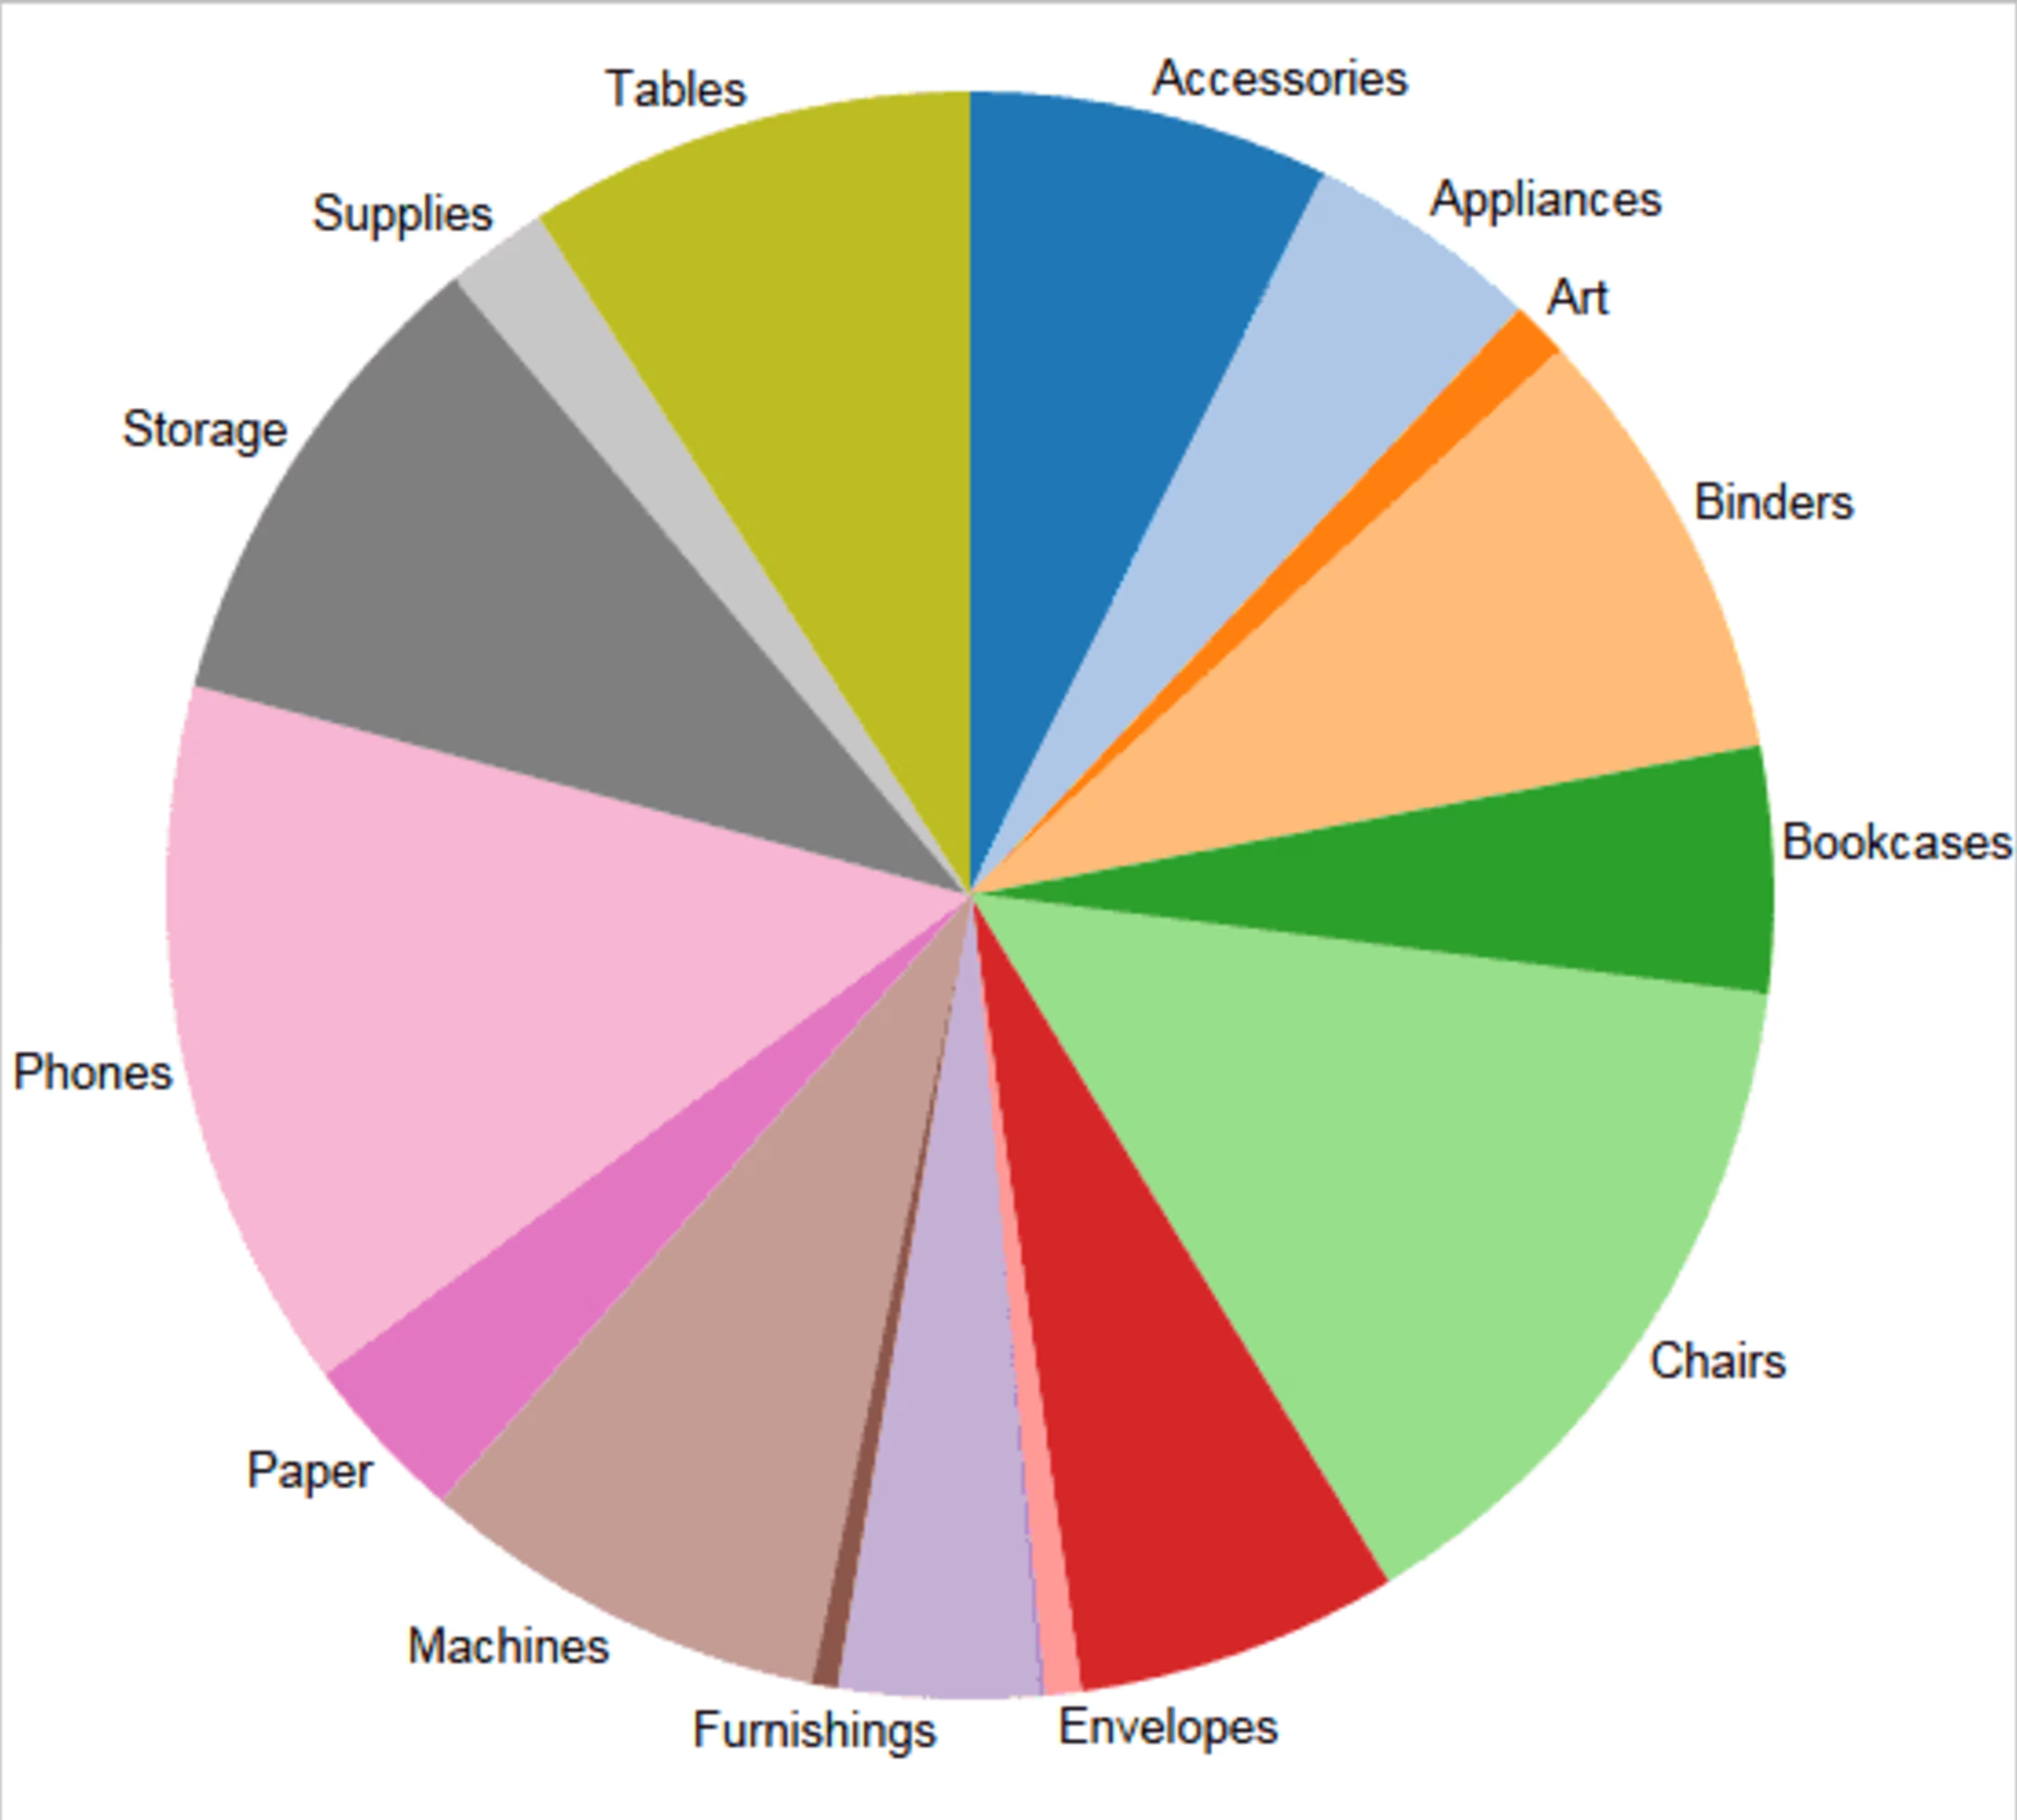
All of a sudden, determining where your money went is far less challenging (Source)
And visualizations like the above, in turn, can deliver useful information.
Which brings me to the next buzzword ...
2. Actionable insights
This phrase is thrown around in software ads and journalism as often as references to Patreon on struggling YouTube accounts.
"Actionable insights" are realizations you can act on. For instance, if you find that sales increase when you spend extra money on social media ad campaigns, your actionable insight is that you should spend more money on social media ad campaigns.
To put it in terms of the Bill Cabiró quote, actionable insights are the right information that allow you to make those right decisions.
There's a perception (created by the ad-speak, I'd argue) that you can put data into your BI platform and get back actionable insights, in the same way you feed money into a vending machine and get back pretzels.
How the buzzword causes confusion
Business intelligence software can help you make actionable insights, but it doesn't automatically give you actionable insights.
Digital Analytics Power Hour co-host Michael Helbling says an impression among many BI buyers is that "all we need to do is get the right tools, and amazing insights just start flowing out of them."
Co-host Moe Kiss adds that when it comes to monthly reporting people can ask, "What are your monthly insights, and you're like, 'well, I can tell you about our monthly performance,' but that doesn't necessarily mean there's going to be anything groundbreaking in there."
The truth, instead, is that buying BI software doesn't necessarily result in insights, actionable or otherwise. The first purpose of BI software is to help you ask—and answer—questions about your data. But first you need to know what questions need answering.
Think of BI software programs as tools that can improve the way you look for insights... but you still need to know where, and how, to look for those insights. BI software enhances what you can look at and the angles from which you can view it.
There's a name for that way of looking, and it's another buzzword: Being data-driven.
3. Data-driven
Data driven means you're thinking in terms of data.
When someone asks you how your business is doing, a data-driven answer would be something like, "Last month we had 3% year-over-year growth." A non data-driven answer would be, "We're doing well."
Rather than basing your decisions on hunches, or standard operating procedure, you use data as your basis. You typically see "data-driven" contrasted with phrases such as "gut decisions," or "choices made on instinct."
How the buzzword causes confusion
You don't need massive amounts of data, or a data science degree, to think in a data-driven way.
Ever stepped on a scale and decided to go easy on the donuts? Congratulations, that decision (fewer donuts) was driven by data (the number on the scale).
If your business' culture isn't data-driven, you're losing money. You might be missing useful information if you don't combine, say, demographic info, time of year, and method of payment. If you're not thinking in terms of the data you collect, you won't think to ask those questions.
To make your business data-driven, model data-driven behavior yourself. Encourage employees to come to meetings, or do daily work, with data in mind.
Ensure that every data conversation is framed in the context of being a business conversation, and every business conversation is framed as a data conversation.
Alan Duncan and Lydia Clougherty Jones
Gartner Analysts
Acknowledging that connection between business and data will also help you in the long run. Data's not going anywhere: The majority of things (from flower pots to jean jackets) are going to create and record data in the future. That data could provide you with the chance to make money.
For example, any business with a fleet of vehicles can easily turn employees' smartphone data into savings. Software that can track your location and provide a more efficient route, can save you cash by finding shorter routes. The gas savings add up, fast.
4. Dashboards/data visualization
I'm pairing visual-based data discovery with dashboards, since so many visuals end up on dashboards.
Data visualizations are any picture or image that represents a data set (a pie chart of last month's expenditures or a bar graph of sales by region). Dashboards are collections of particularly important or relevant data visualizations.
Dashboards and visuals are the face of business intelligence software. After all, accessibility is one of the main benefits of modern BI: Excel spreadsheets look like a mess, but pie charts are easy on the eyes.
If it seems like data visualization is the focus of a lot of business intelligence, that's because far more people think visually than mathematically.
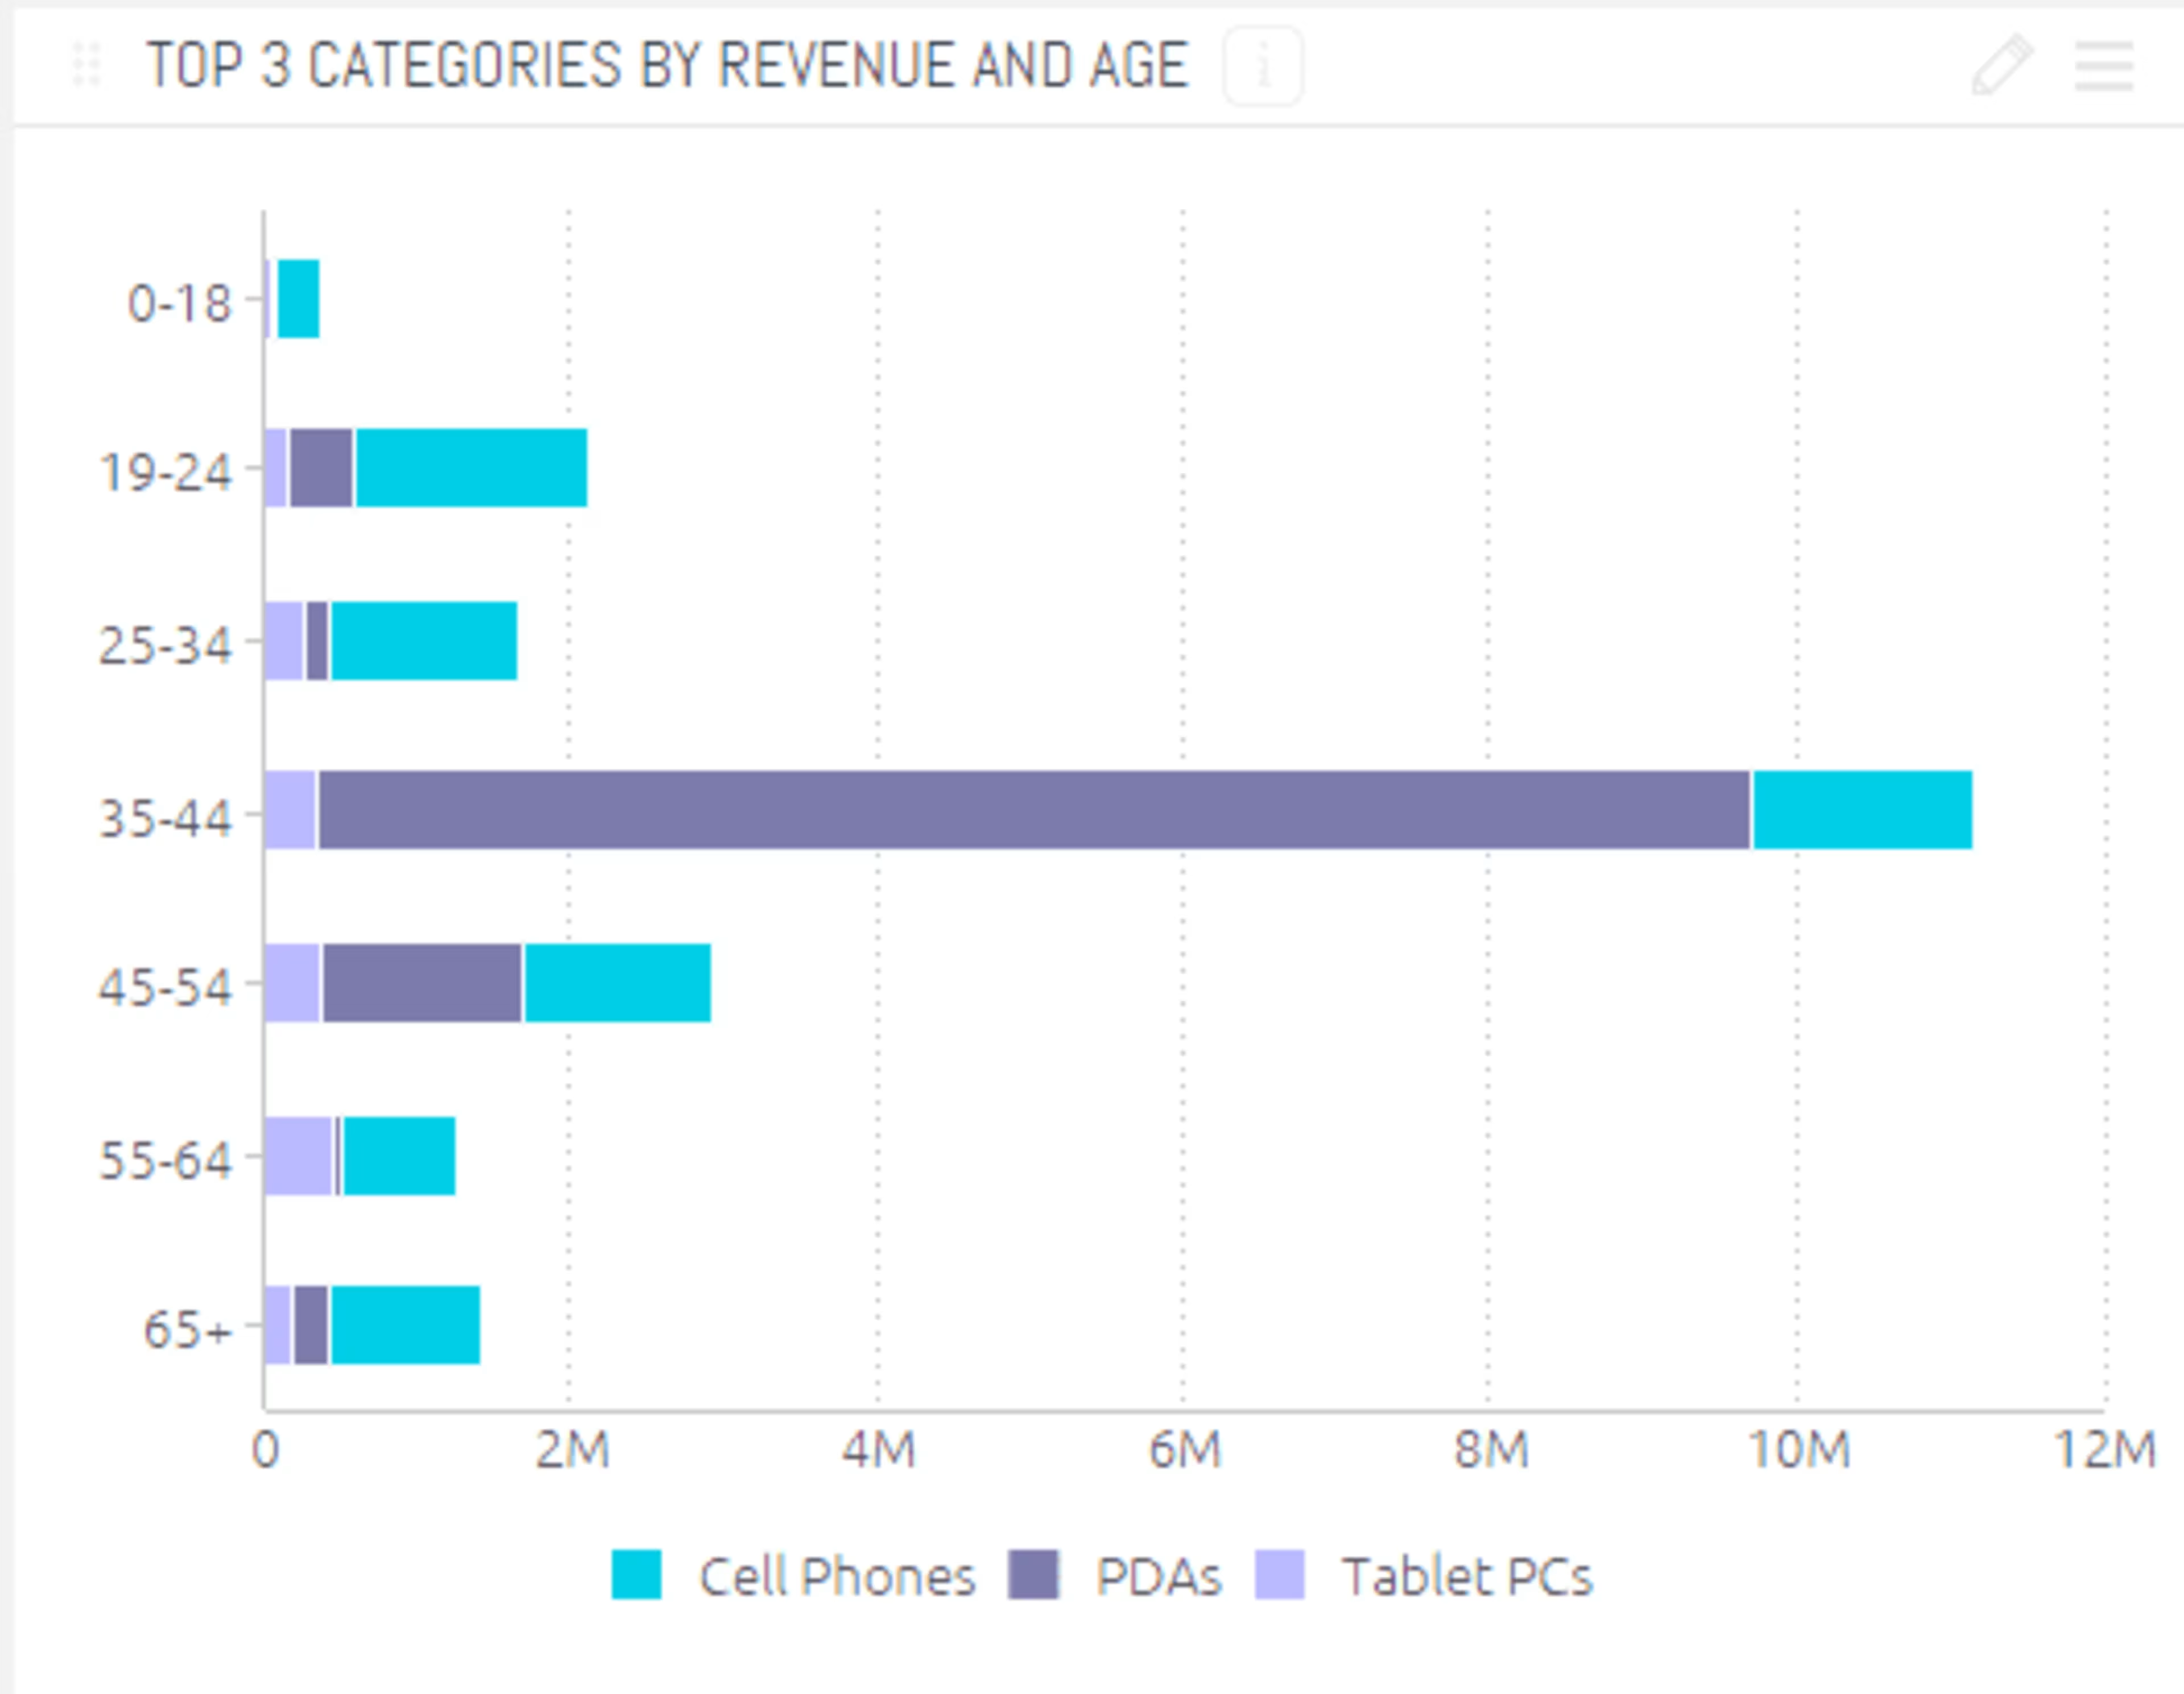
A data visualization made with BI program Sisense (Source)
How the buzzword causes confusion
Dashboards are helpful, but they aren't everything. Don't forget that dashboards exist to display your data and not for their own sake. If you focus too much on the dashboard, you're not going to get the benefit out of your business intelligence software purchase.
Repeat after me: Dashboards and data visualization are not your end goal. Dashboards and data visualization are not the same as insights. They can be incredibly helpful, yes, and they can provide insights. But, they're not the end product.
Informed decision-making is. If a dashboard or visualization helps you do that, great. If not? Don't bother.
5. Single source of truth
Software websites often promise a "single source of truth."
If all your siloed data sources can be collected and analyzed by one BI program, accessible by everyone, then you'll have better decisions and fewer arguments.
That's the idea, at least.
How the buzzword causes confusion
Don't expect there to be a single source of truth.
People will have different opinions, even if they have access to the same data. Teamwork prevails, as in anything.
Don't assume BI software is a magic bullet for disagreements or differences of opinion. It will give you better data with which to discuss (and maybe even debate), but the discussion will still be there.
This is why Gartner analyst Frank Buytendijk suggests you ditch the search for an absolute analytics truth, and instead look for "multiple versions of truth that may not be truthful, but are at least trustworthy."
Don't look for one ideal perfect insight but rather insights your employees can bring to the table. This collaborative view of your data will provide a stronger base on which to build your analytics strategy.
6. Easy-to-use/self-service business intelligence software
The term "self-service business intelligence" arose in contrast to traditional business intelligence software, which was so complicated that people needed a different "self," usually an IT person, to use the software.
Who is the "self" in "self-service business intelligence? Technically, anyone: you, your CTO, your head of sales, and their whole team.
Who's realistically the "self" in "self-service business intelligence?" It depends.
How the buzzword causes confusion
Anglo Liners managing director Grant van der Harst explained to me why this buzzword is misleading: "A BI tool that is 'easy to use' for a developer or tech guy is not necessarily true for a member of staff working in a small business, who is using it for the first time."
As van der Harst suggests, the average employee may be confused by a "self-service" BI tool.
Modern BI software is self-service, though there's still that learning curve van der Harst mentions. How steep the curve is depends on the program and the user's technical level. If your team isn't tech savvy, the curve's steepness will also depend on whether your purchase includes support or the training courses offered by some vendors.
People see "self-service" and purchase. Don't fall into this trap. Check out the trial version before you buy BI, or download a free or open source business intelligence software program, and see if you can use it.
If you make a decision too quickly, you'll waste money and wind up with expensive licenses your employees don't know how to use.
7. Analytics stack
The analytics "stack" is whatever data you collect and the tools (data, ETL tools, data warehouses if you need them, BI tools) you use to turn that raw data into a finished product you can access and analyze.
"Stack," however, is about the worst metaphor you could use. It implies order (to my mind, at least), with the biggest things at the bottom and the smallest at the top.
Your analytics stack, however, looks more like a jumble of digital sources and information. It may look like a stack if you understand tech. If you're like the rest of us, however, it's a jumble.
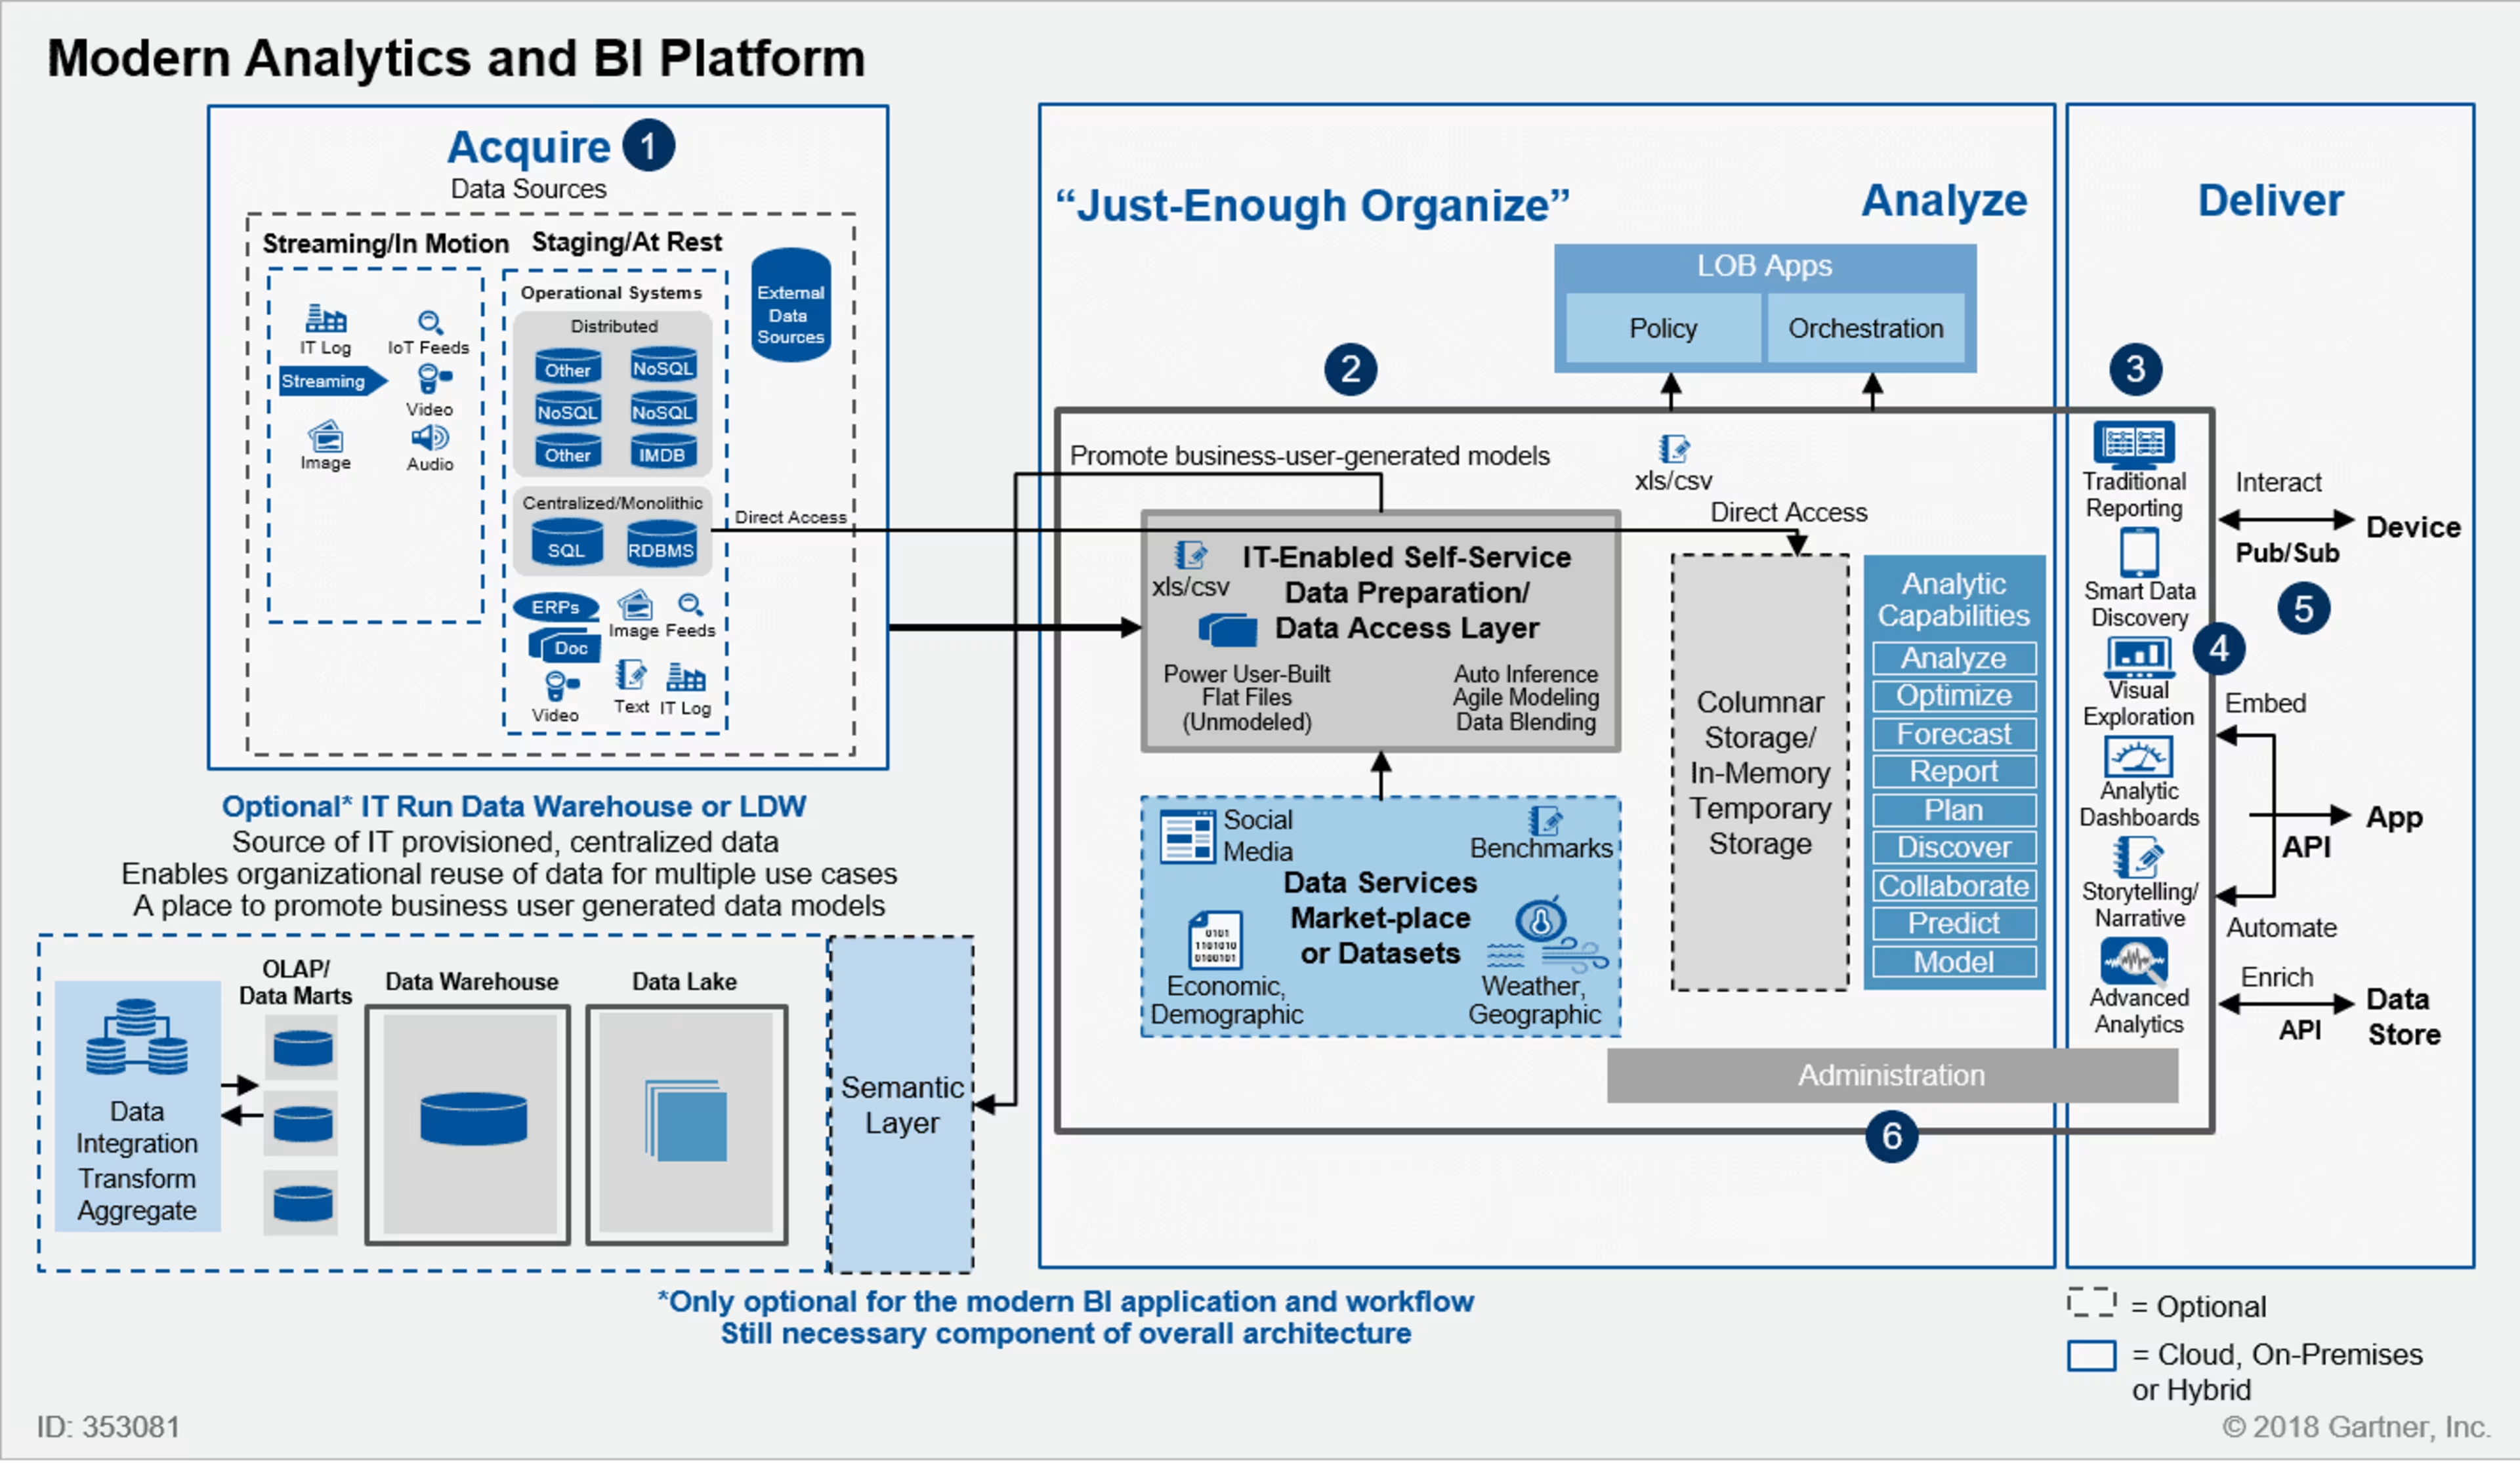
This is valuable information, but it is a "stack" in the same way a pile of Jenga blocks, freshly collapsed, is a stack (Source—full research available to Gartner clients)
How the buzzword causes confusion
Whether the data you're tracking is stack-like or jumble-like, know what data you're collecting and how much of it there is. Don't be intimidated or distracted by the lingo, just focus on your data. Don't be intimidated by the amount you have to learn, either.
Focus, instead, on your data and how it needs to be cleaned and prepared before you analyze it with a BI tool.
8. Delivery: cloud and on-premise
"Delivery" suggests a physical process or transmission, such as a mailman delivering a package. If you don't know computers, it's hard to understand what's being transmitted or processed, especially since electronic data isn't exactly physical.
"Delivery" refers to where the software is delivered from.
In a cloud or software-as-a-service-style delivery, your software is delivered from the cloud (i.e., servers owned by the BI software company). Rather than buying and owning the software program, you buy a license and simply use the software.
For on-premises delivery, the program's "delivered" from your computer's hard drive, or from your own servers.
For hybrid products, some work is done on your servers and some on the BI company's.
How the buzzword causes confusion
How do you pick the delivery method that's best for your business?
My recommendation is that cloud solutions are best for small businesses. Believe it or not, running software on someone else's servers is safer and cheaper than owning your own.
This may seem counter-intuitive, especially since the data your business collects seems like something you'd want to hold close.
However, the security provided by cloud vendors is better than any other solution you might try. Moreover, cloud software is cheaper than having to buy servers.
9. Augmented analytics/smart data discovery
In the late 1990s and 2000s, business intelligence software moved from complicated to "self-serve." In the next ten years, business intelligence will move from self-serve to augmented analytics (formerly called "smart data discovery").
So what's augmented in augmented analytics? The software—and what you get out of it. Specifically, the software is augmented with machine learning.
One example of this augmentation is natural language processing (NLP). "Natural language," in this case, means plain English. BI software with NLP lets you search your data by asking questions in English, the way you would with a search engine. Instead of having to know how to look up, say, monthly revenue, you just type "what was January's revenue" into the software's search box, and you get the answer.
NLP searches are just one way augmented analytics will change business intelligence software. Augmented analytics promises to also help with data cleansing; for instance, automatically determining that those 18,000 "OH's" in your spreadsheet do, indeed, mean "Ohio."
Augmented analytics will also be able to notice patterns and correlations and automatically point them out to users. That means you'll spend less time hunting for observations and more time acting on the ones the software finds for you.
How the buzzword causes confusion
Don't think the term “augmented analytics" represents an entirely new topic you have to learn about or that you have to change the way you look at everything.
“Augmented analytics" is just analytics software (i.e., BI software) that does some of the work for you.
As a shopper, you just need to be on the lookout for vendors who have augmented analytics capabilities. When you shop for business intelligence software, ask what sort of augmented analytics capabilities the vendor offers and how augmented analytics figures into their product roadmap.