
Worried you're mixing up correlation and regression? Read on to learn the difference.
You already know that statistical analysis is a must for any business trying to fine-tune its efforts to boost growth and increase its reach, but do you know the difference between different statistical measurements?
Take correlation and regression, for example—you've likely heard the terms before, but do you know enough to compare and contrast them? If the answer is no, don't worry: we're here to help.
Let's take a look at what exactly correlation and regression are, then compare the two to further highlight the differences between them. Ultimately, this knowledge can help you analyze and predict essential statistical measurements that will, in turn, help your business succeed.
What is correlation?
In the simplest terms, correlation describes when a change to one variable leads to an observable change in another variable, no matter whether that change is direct or indirect.
Conversely, two variables are labeled uncorrelated if there isn't an observable connection or change when one or the other changes.
It can help to think of it in mathematical terms; If a change in X makes Y change, then the two are correlated. If a change in X doesn't change Y, then they aren't correlated.
When it comes to your business, correlation can come in handy when tracking things like sales and demand. If a product is in high demand, then sales will increase. If a product isn't as popular, then sales won't. This is textbook correlation, whether positive or negative.
What is regression?
In similarly simple terms, regression describes how one variable impacts another. It helps to think of regression as cause and effect: if this variable is introduced, then how does that variable change?
Regression is less about the relationship between one variable and another and more about how one variable changes another over time. Thinking of regression in mathematical terms can help again here; If X increases, what happens to Y? If X decreases, how does that impact Y?
Regression analysis helps businesses make predictions for the future. By looking at how two variables have impacted one another in the past, you can try to map out how they will continue to impact each other in the days, months, and years to come.
Difference between correlation and regression
While correlation deals with observing relationships between two factors, regression is more about how that relationship impacts each of the variables over time.
In other words: you can't have regression without some sort of correlation but you can have correlation without knowing a thing about the variables' regression.
Let's once again think of these concepts in mathematical terms. Regression defines the way one thing causes another to change, meaning that swapping the variables will change your results. With correlation, variables are more or less interchangeable; putting one in the other's place won't change the results.
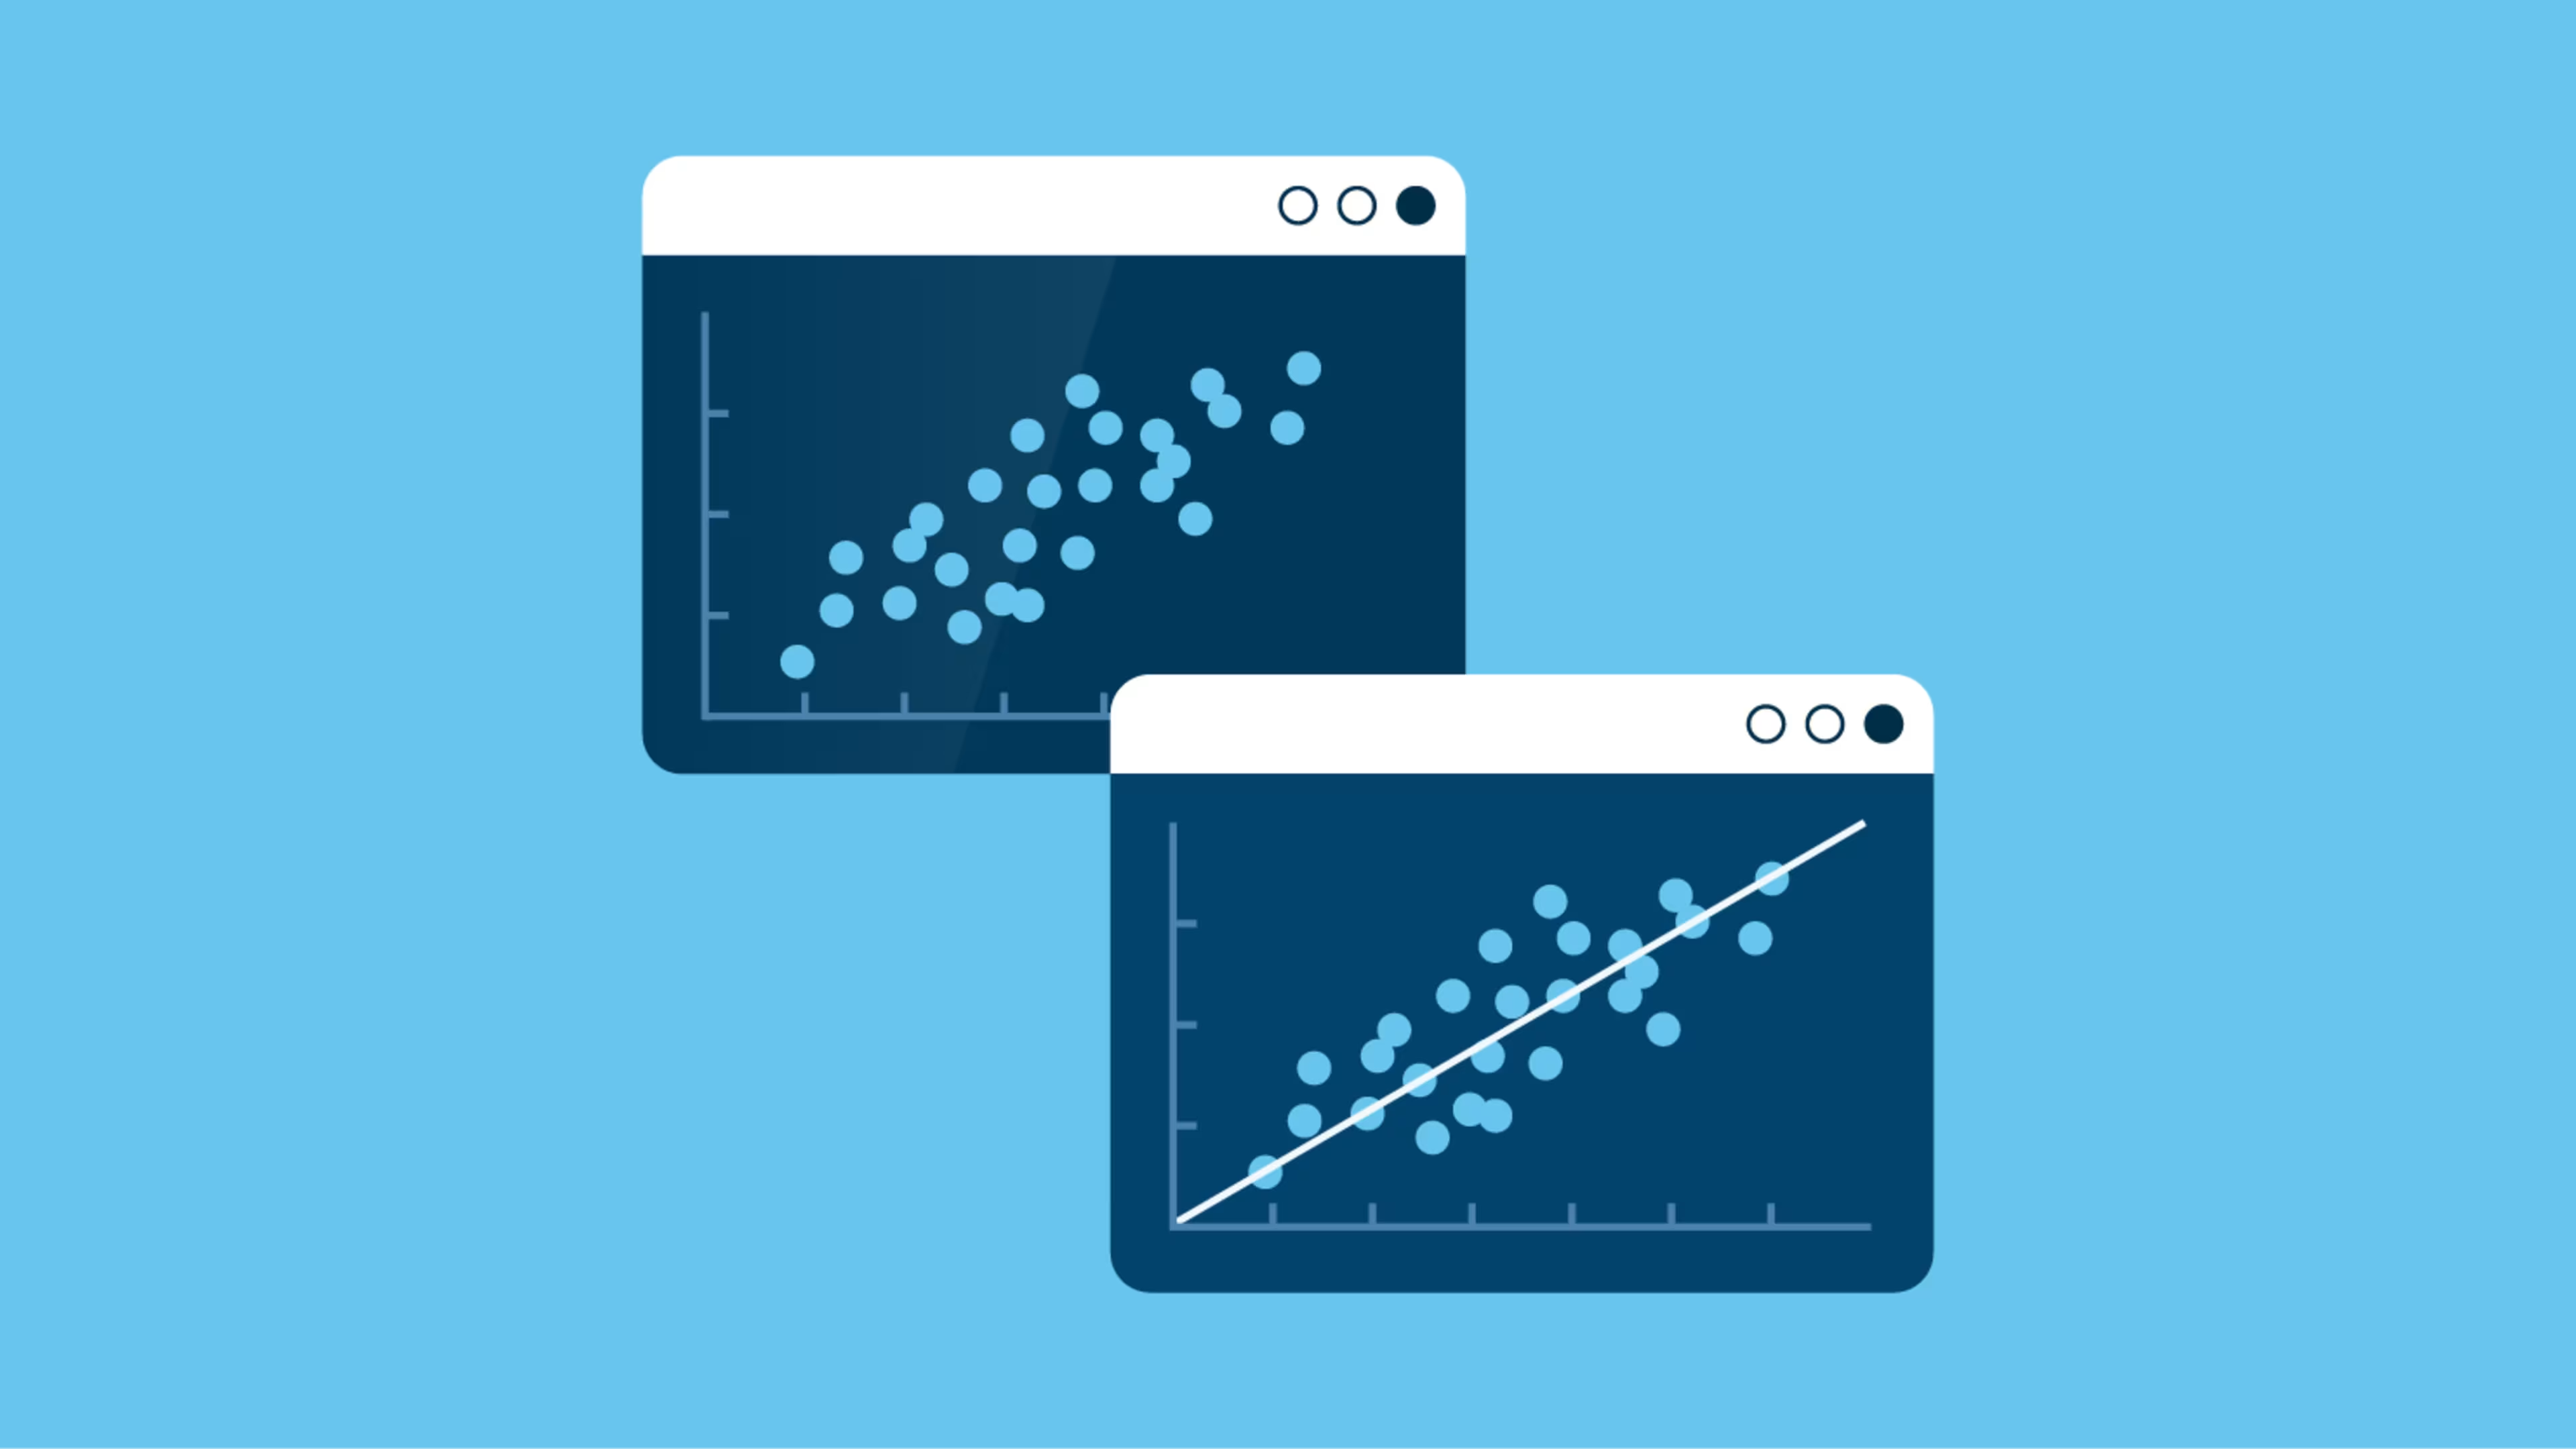
Graphically speaking, regression is represented by a line, while correlation is represented by a single data point.
Similarities between correlation and regression
There are many similarities between correlation and regression; the two concepts work together, not apart.
For example, correlation and regression are both used to describe the relationship that exists between two variables or numbers. If the correlation between two variables is negative, then the regression between the two variables will also be negative.
Understanding how these two terms are similar and how they differ is the key to using them to their full potential for your business.
The bottom line: analyzing data with correlation and regression
Correlation and regression are not the same as cause and effect. In truth, correlation and regression help you clearly analyze your data so that you can identify actionable insights to benefit your business going forward.
Of course, you don't have to do this all on your own; a business intelligence tool can help with your data collection, analysis, and math to make the connections for you.
Explore top BI tools, compare features, and read verified user reviews on Capterra.