Visualization can help you understand projects and timelines. Check out the top five project management solutions that offer this capability.

Project management tools with visualization capabilities can help managers and their teams monitor complex project variables such as resource allocations or time and budget constraints. Visualizations present project data in dashboards and interactive graphs instead of spreadsheets, which enhances collaboration and helps eliminate ambiguity.
When it comes to the core of visualization capabilities, however, not all products are equal and each has strengths and weaknesses. We analyzed thousands of user reviews to find out what real users think about visualization within the project management applications they use. Based on our analysis, we ranked the top five with the highest Sentiment score.
What is a Sentiment score?
Sentiment score is a numerical representation of how people feel. It is a rating of how positive the comments for a product or the features of a product are. Rave reviews get a higher score, lukewarm reviews receive a lower score, and poor reviews get a negative score—all on a scale of 0 to 10.
Top 5 project management software for visualization
Product(click to jump to that section) | Visualization sentiment score(out of 10) |
6.71 | |
6.70 | |
6.67 | |
6.67 | |
6.65 | |
Category Average | 6.55 |
For more on our methodology, click here. Products are listed in order of decreasing Sentiment score.
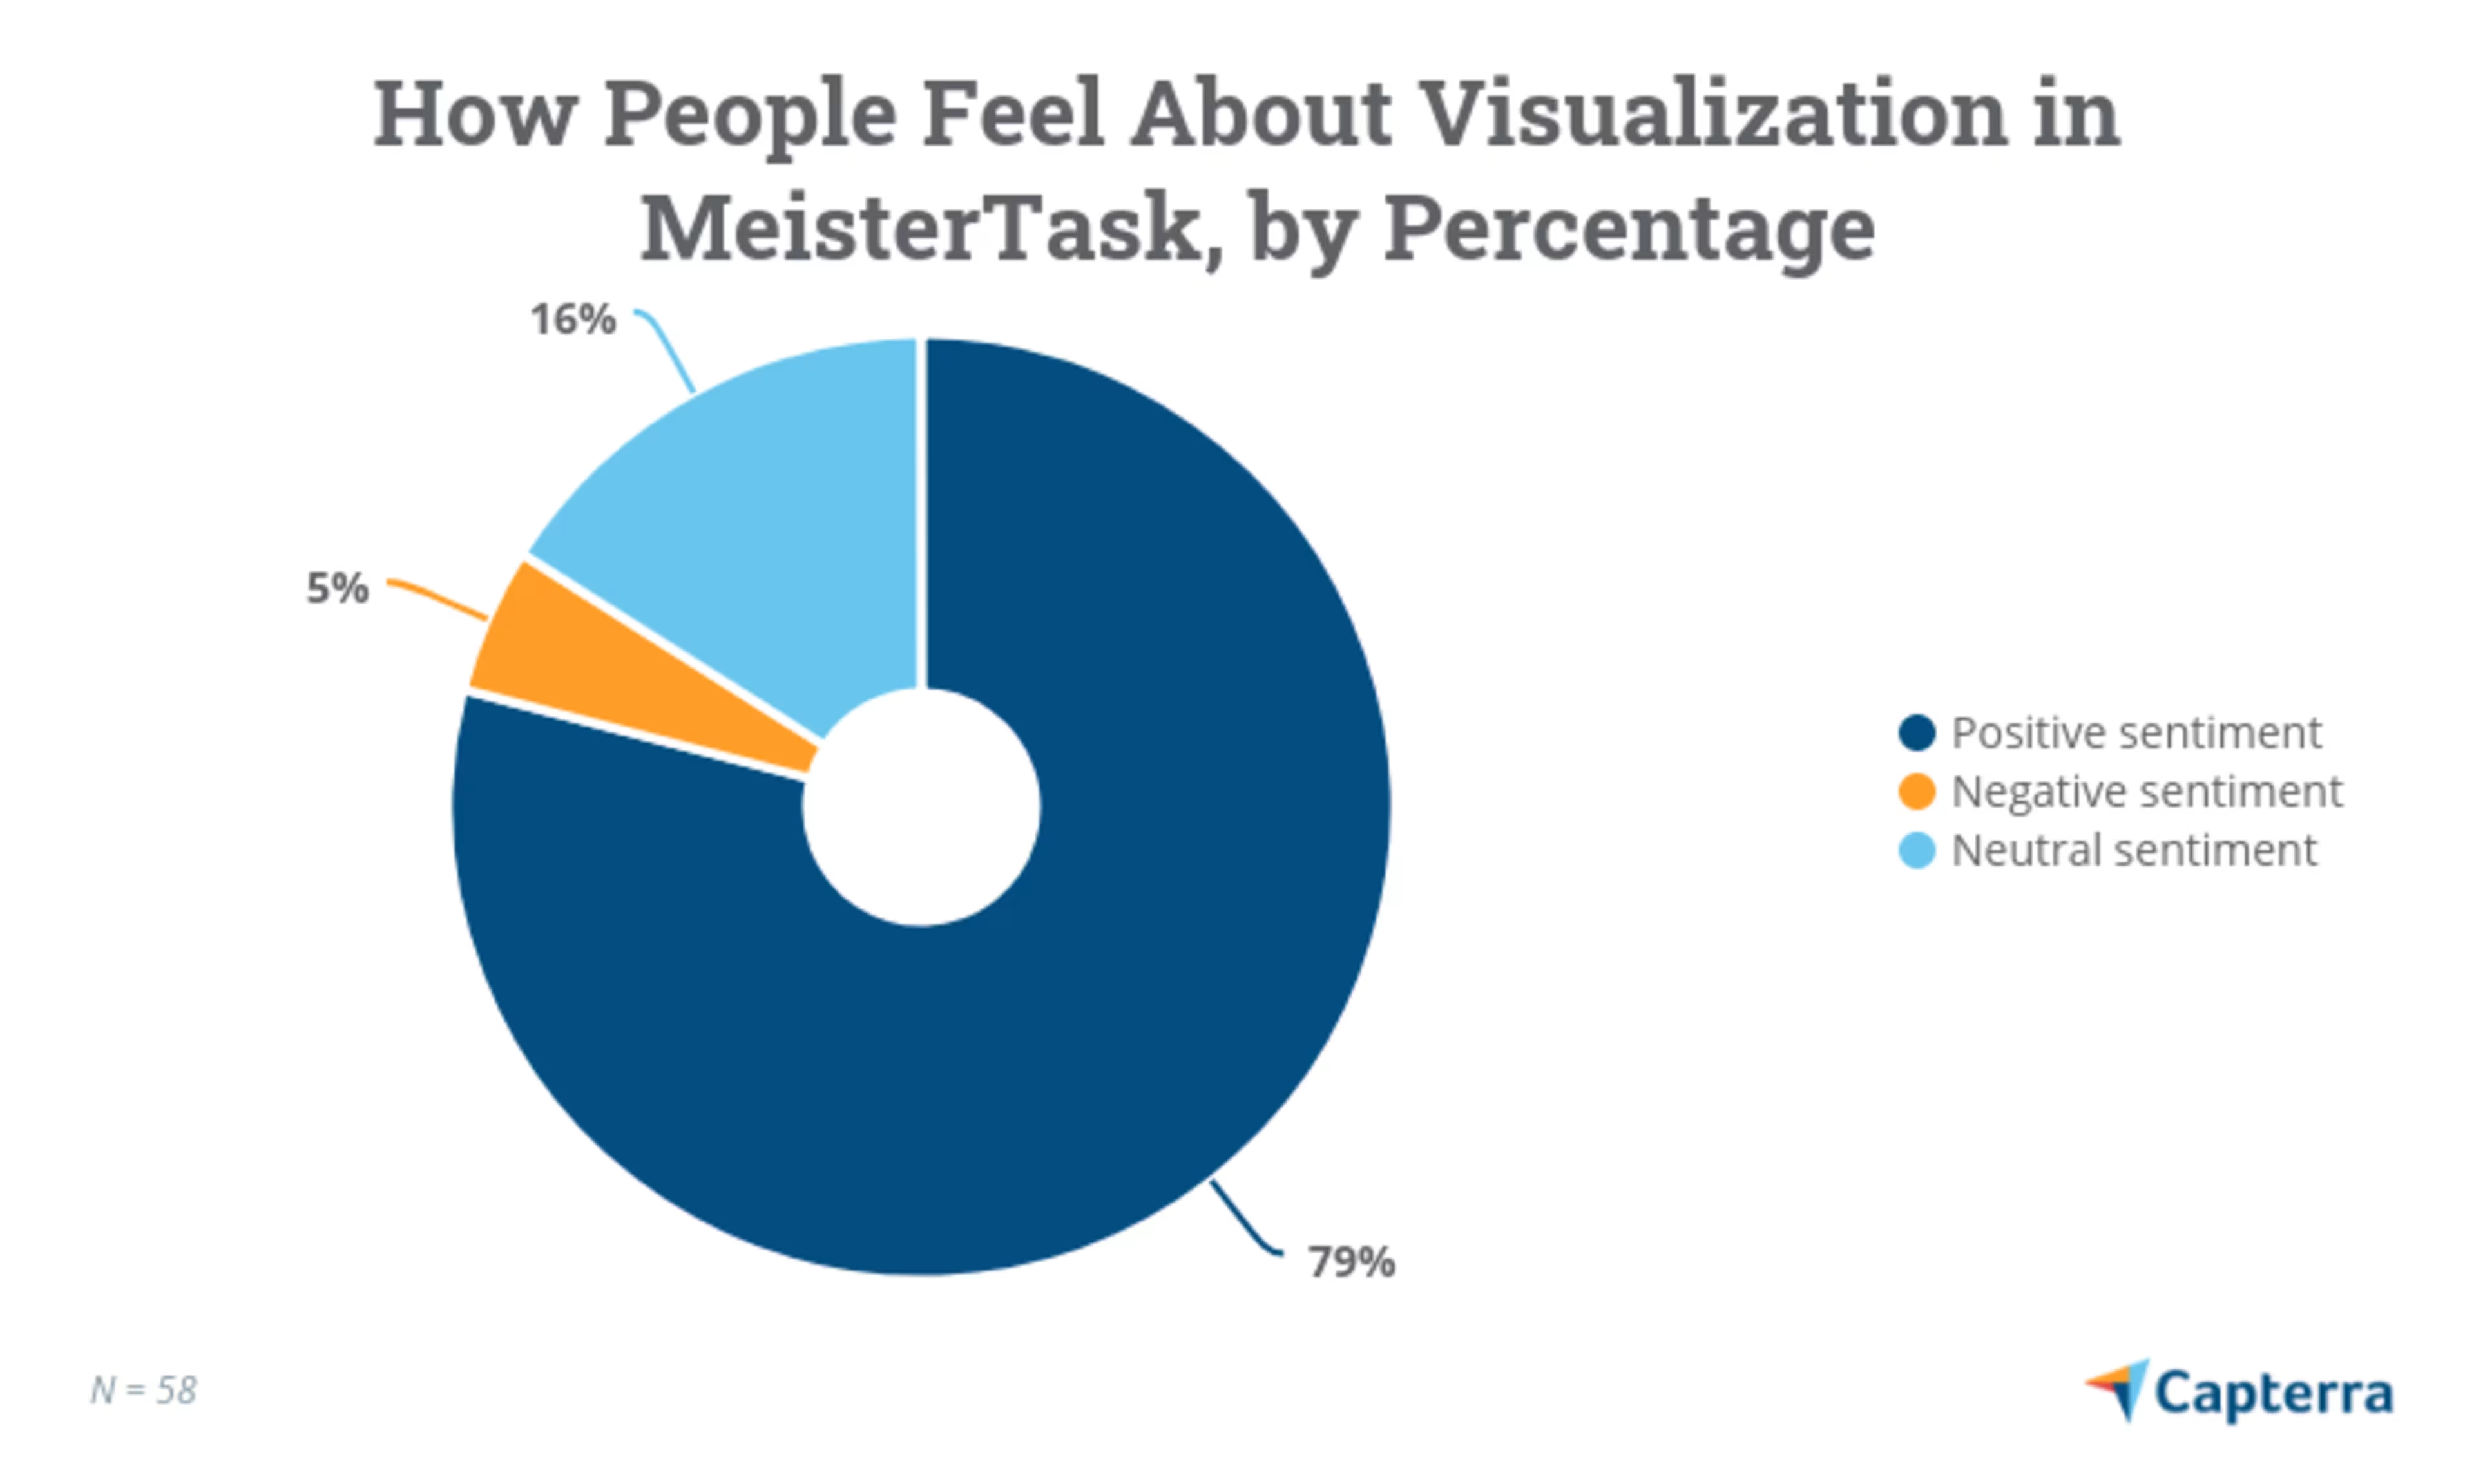
1. MeisterTask
Trial/Free Version
- Free Trial
- Free Version
Device compatibility
MeisterTask is an online task management tool that offers interactive templates and interfaces that can be customized to suit business branding.
The software comes with built-in dashboards that display every live project along with resources assigned and upcoming tasks. Users can fully customize their dashboards to reflect their personality and preferences using a variety of colors, themes, and widgets. The tool provides an interactive Kanban-style board that provides a birds-eye view of the entire project timeline.
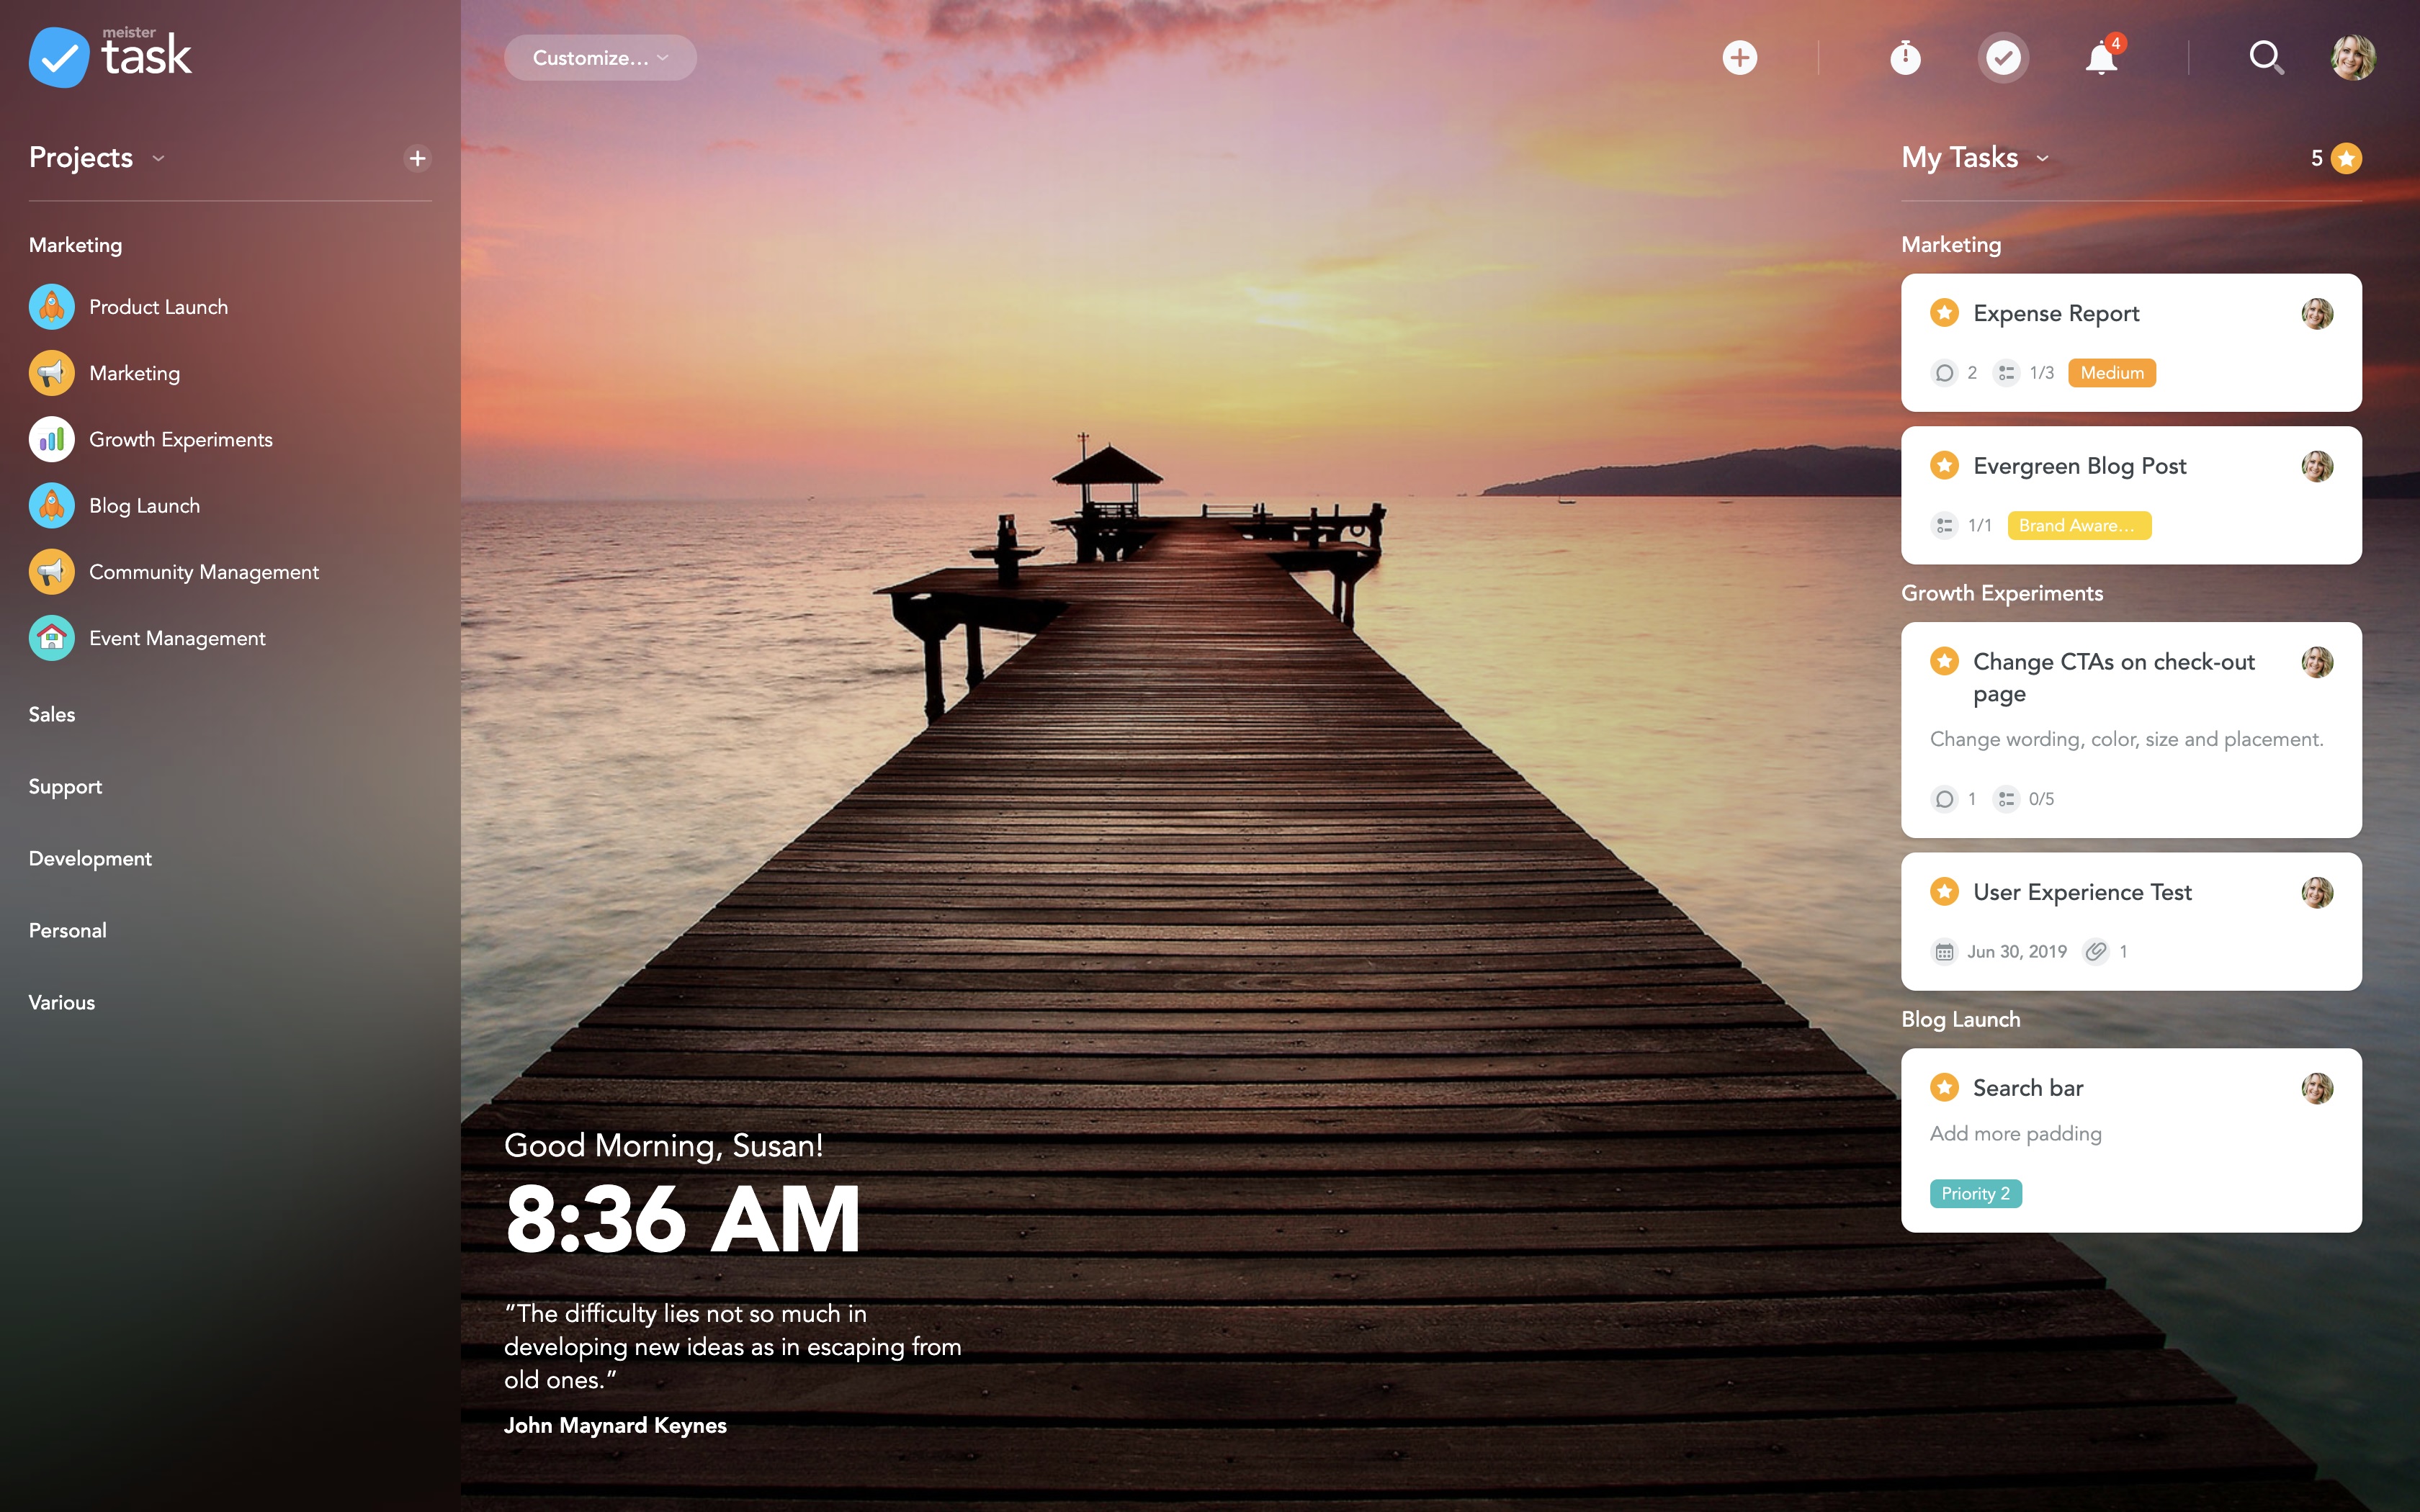
MeisterTask’s customizable project boards (Source)

Overall, 79% of the users reported positive sentiments about MeisterTask’s visualization features.
Read user reviews of MeisterTask
2. Paymo
Trial/Free Version
- Free Trial
- Free Version
Device compatibility
Paymo is an online project management solution with an interactive visual board that distributes projects into a series of tasks listed under “to-do,” “in progress,” and “completed” sections.
Users get the flexibility to customize each section with their choice of color-codes and layout styles. The solution offers a dynamic progress bar that displays project status and the time spent on it. From Kanban to Gantt charts, Paymo supports a variety of project templates to illustrate project timelines and tasks.
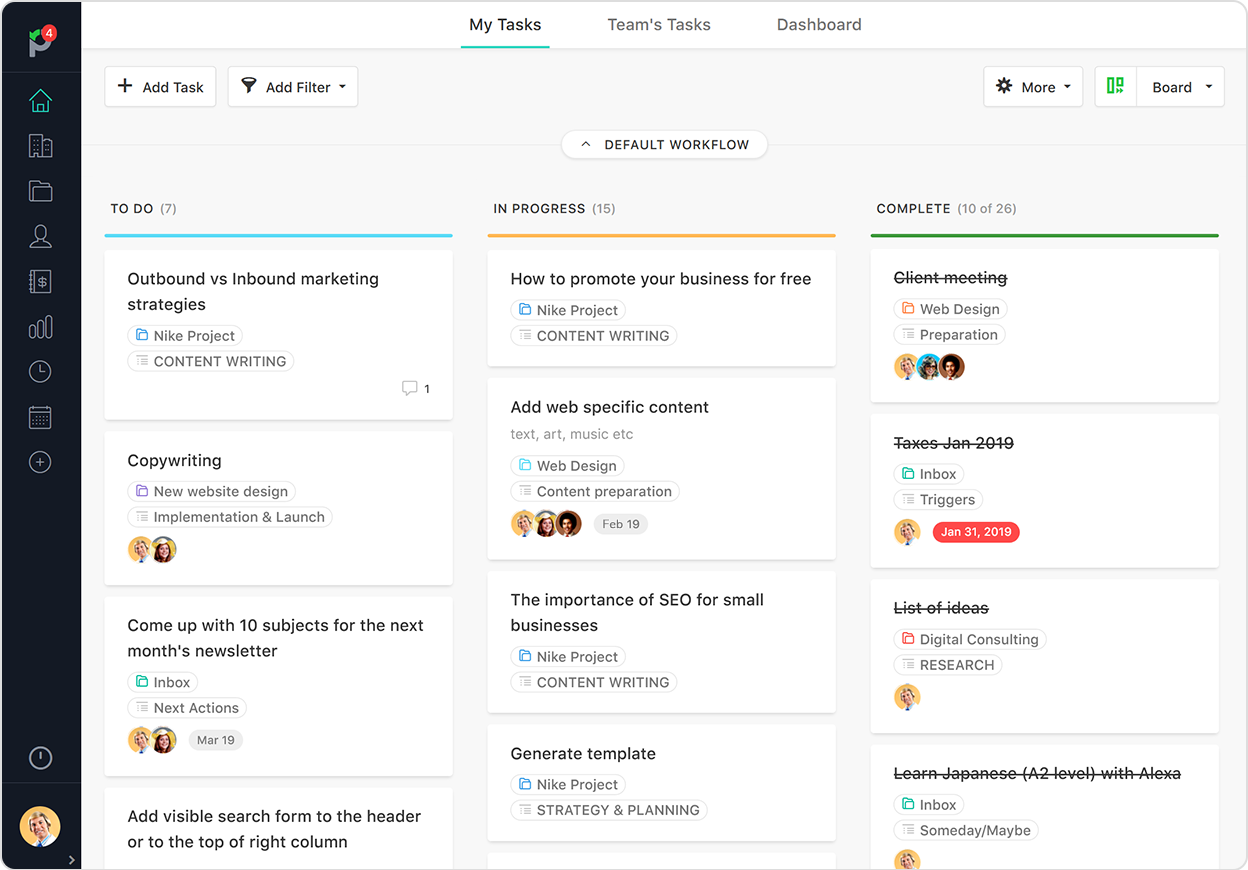
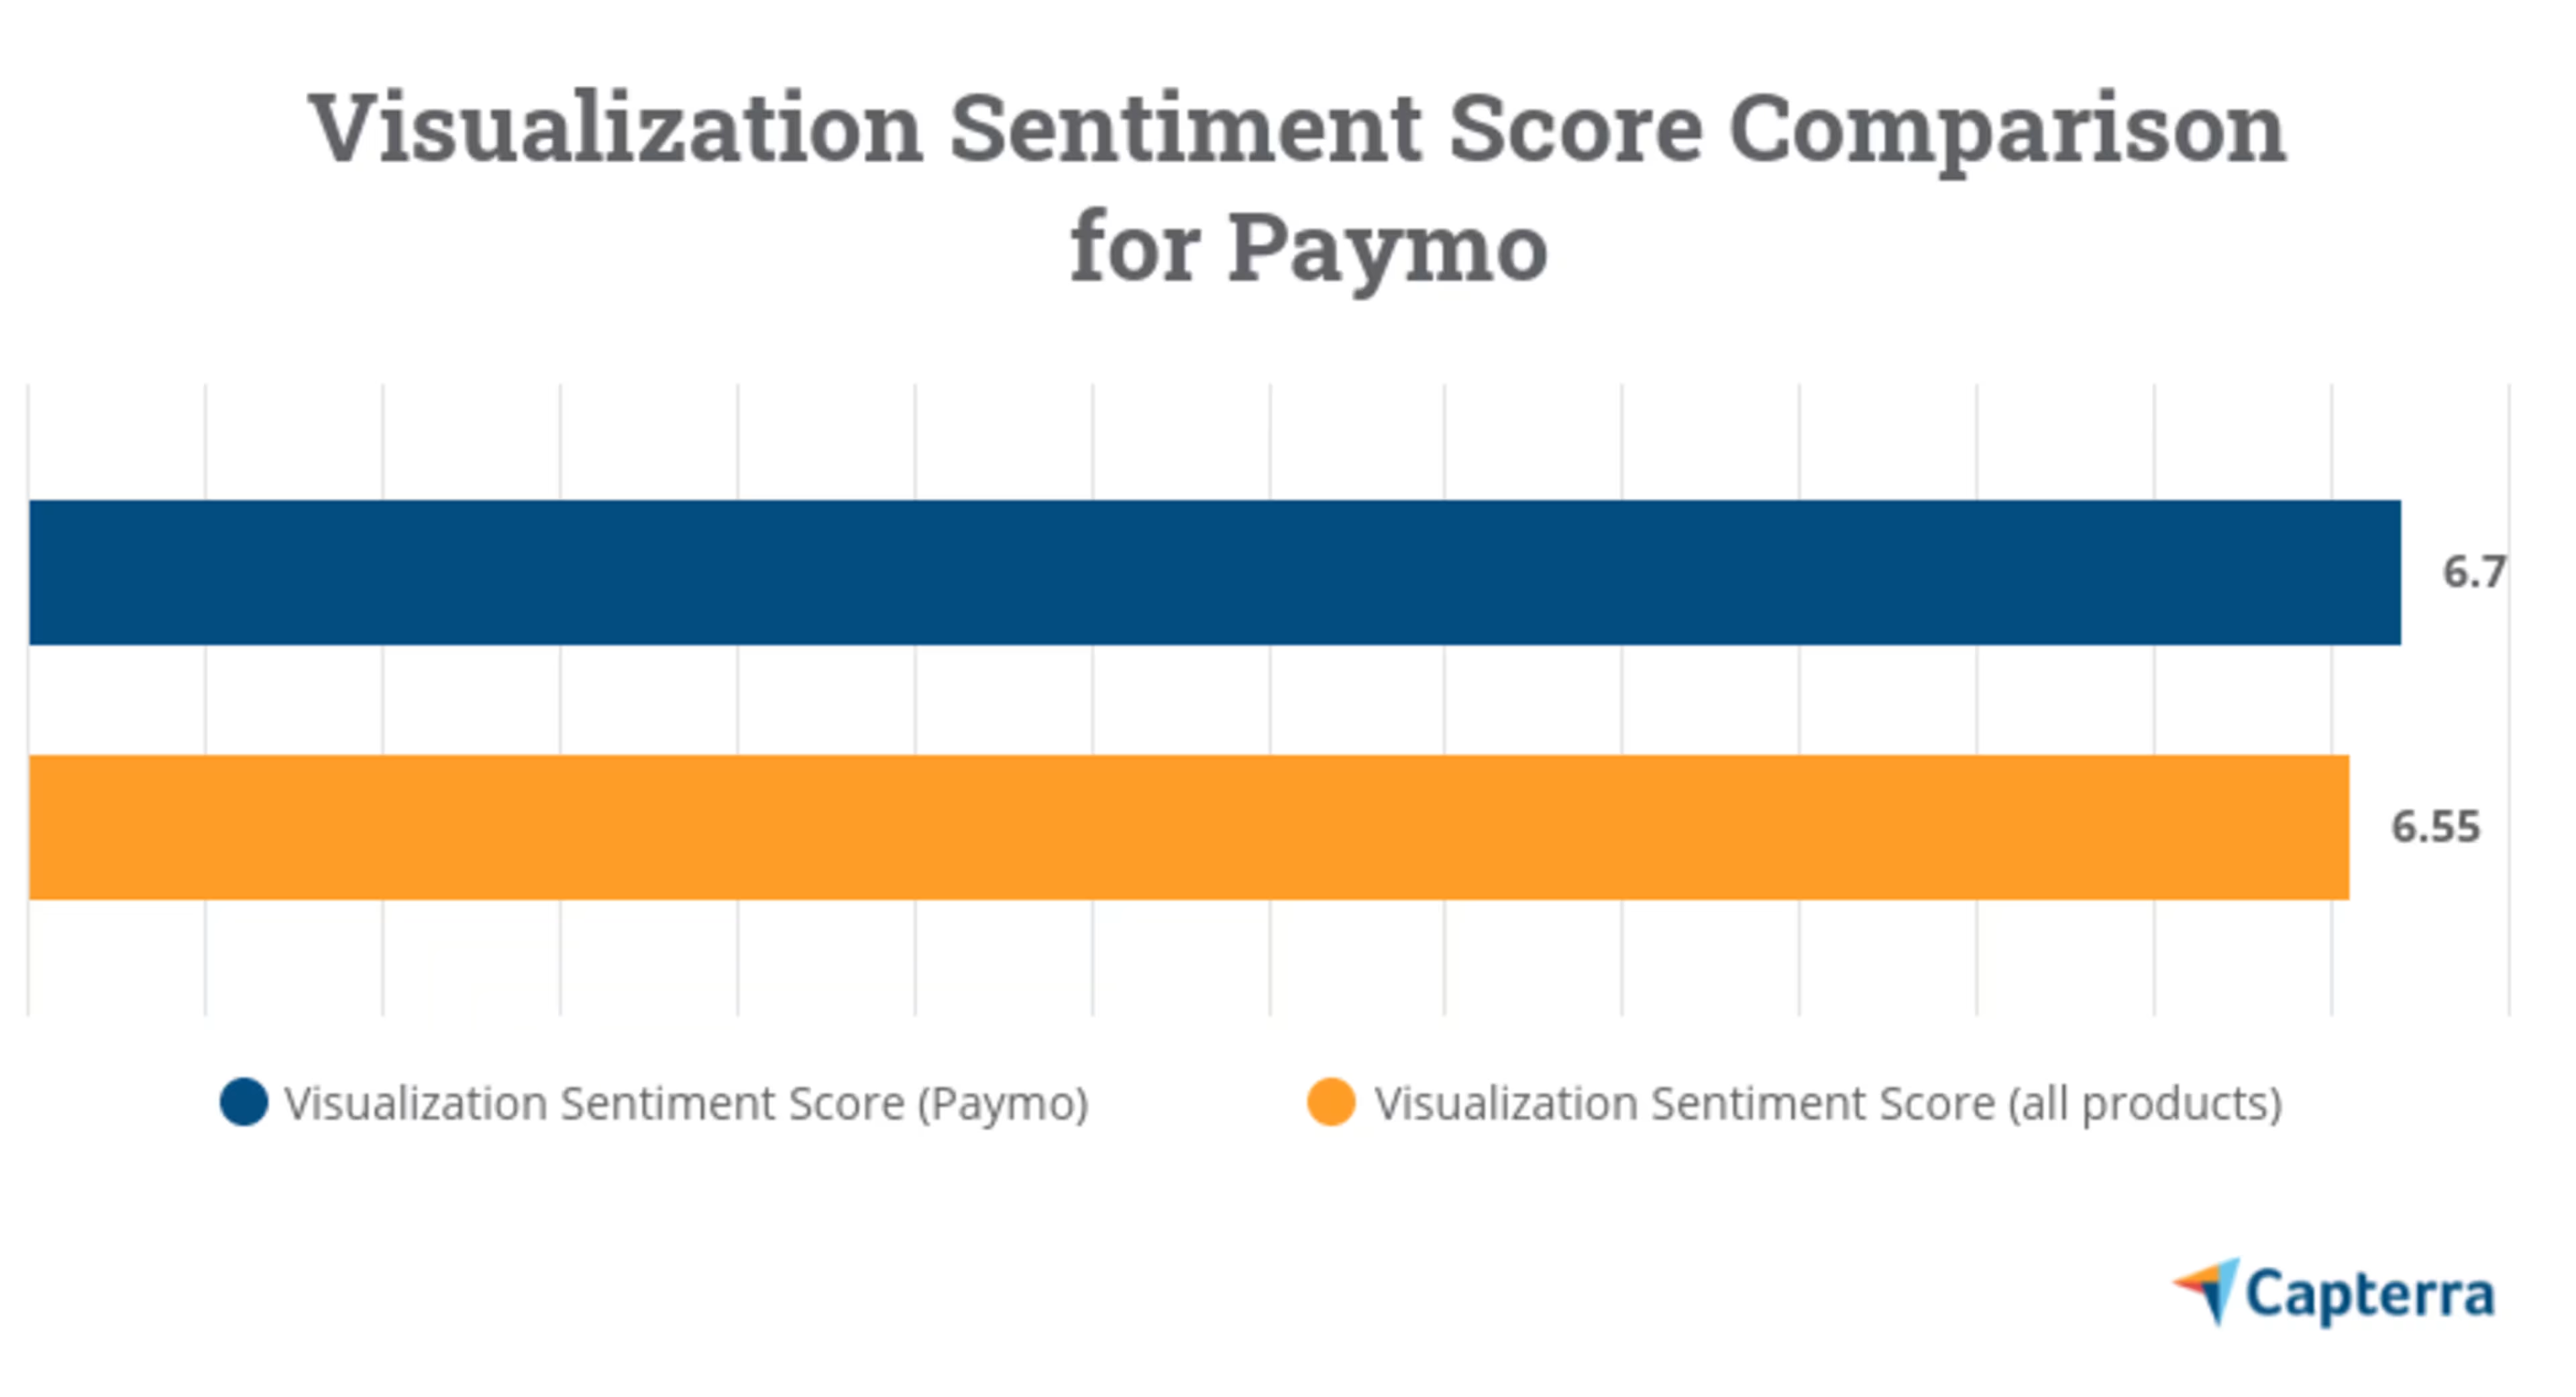
More than 80% of the reviewers are positive about Paymo’s visualization capabilities.

Read user reviews for Paymo
3. Aha!

Trial/Free Version
- Free Trial
- Free Version
Device compatibility
Aha! is an online project roadmap software designed for product and marketing teams.
The software supports a variety of charts and graphs for displaying project details and can be used by businesses of all sizes to map out project journeys on a single, sequential roadmap. Each task can be represented in its own unique style and color. The tool offers an interactive drag-and-drop interface for defining strategic goals and tracking their progress.
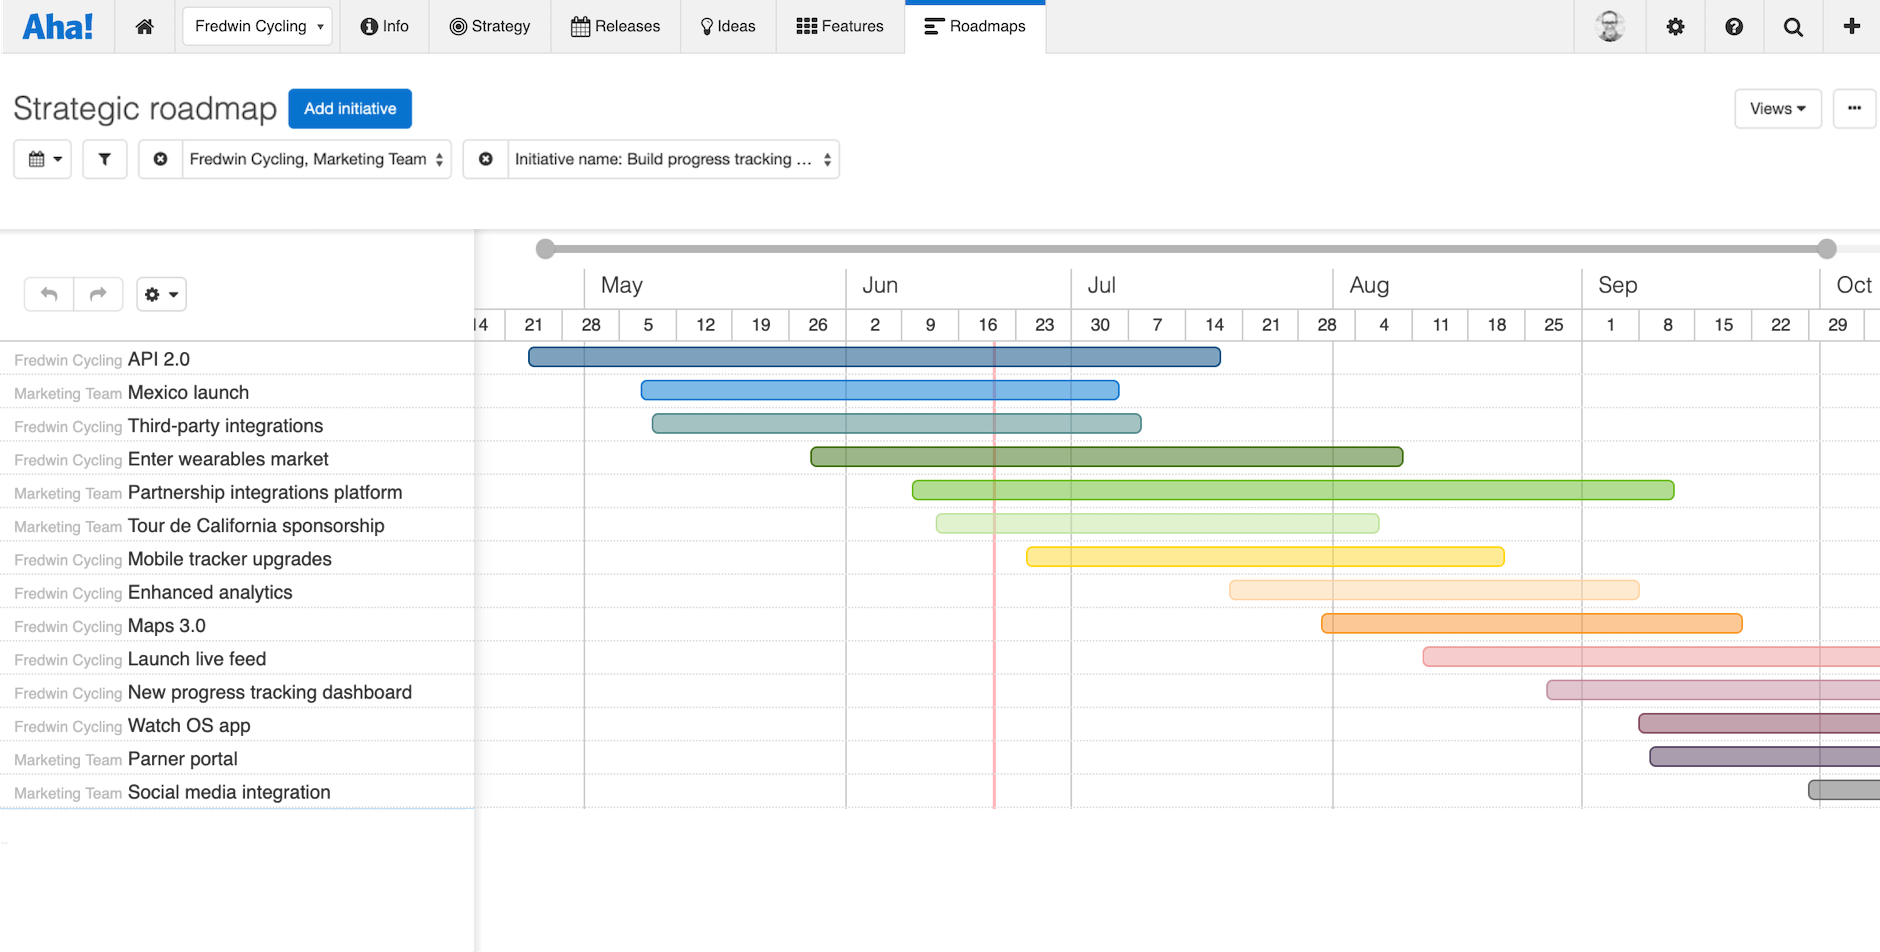

Aha! ranks third in our top project management solutions for visualization with over 80% positive sentiment.
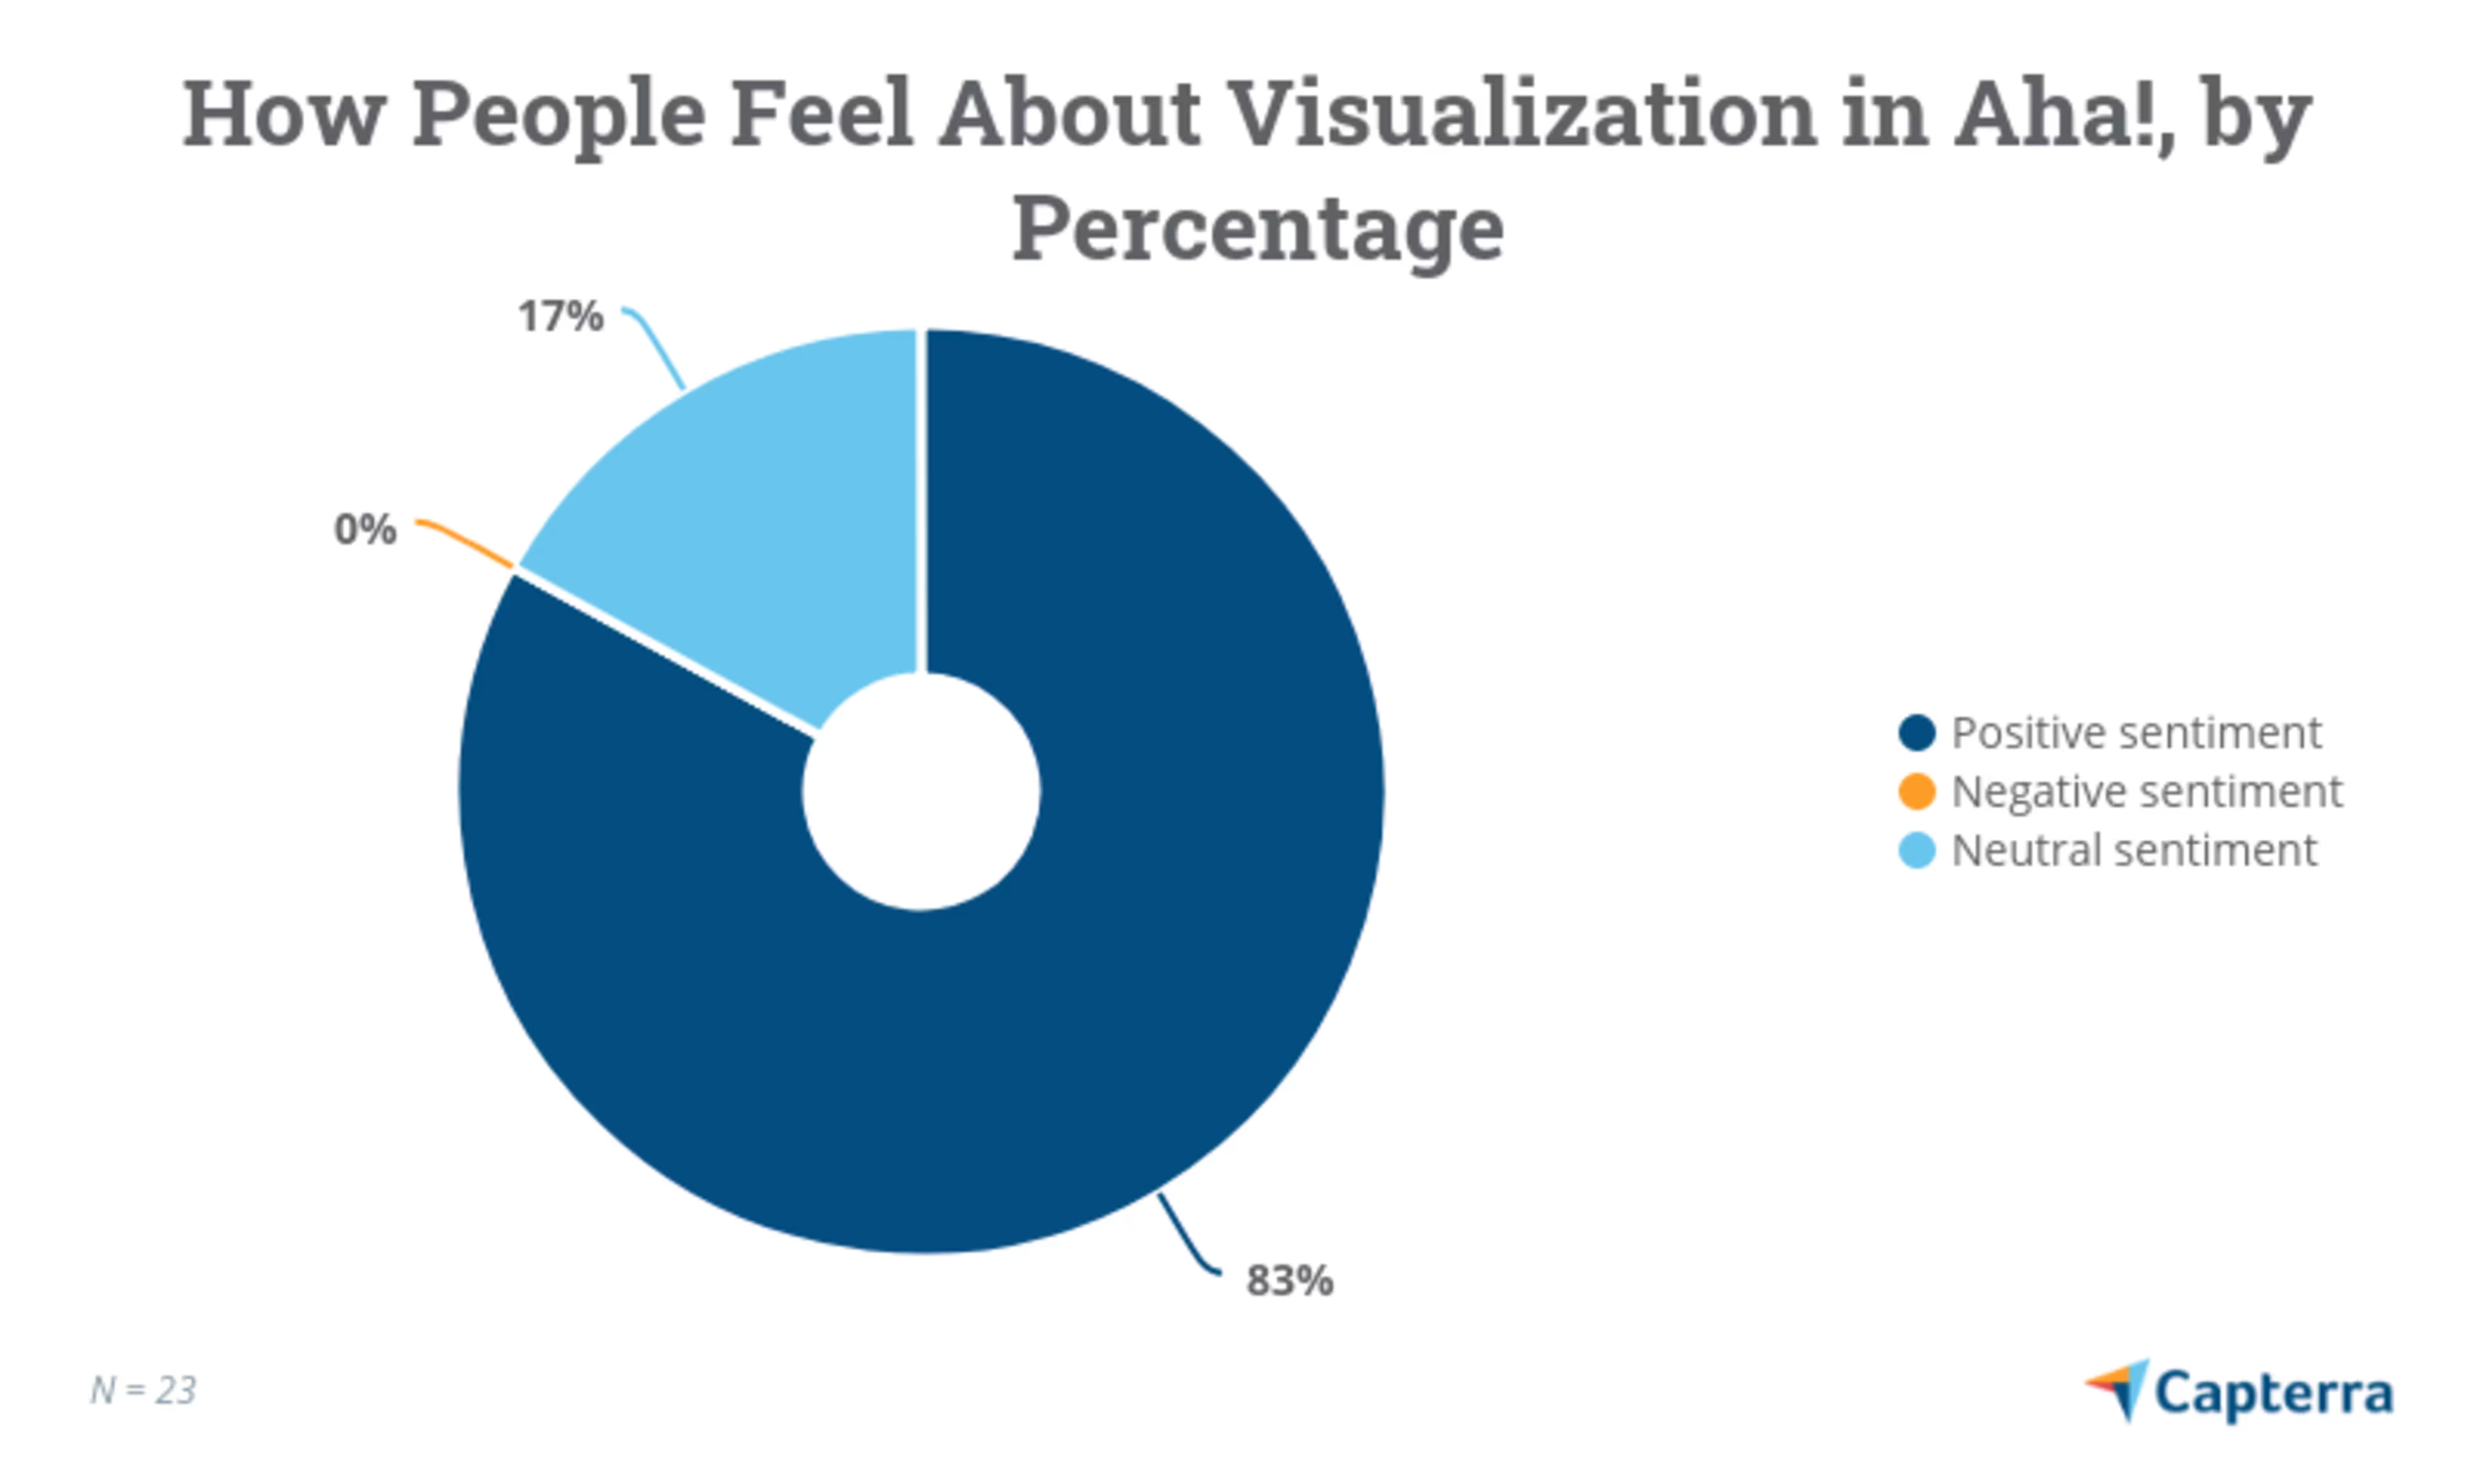
Read user reviews for Aha!
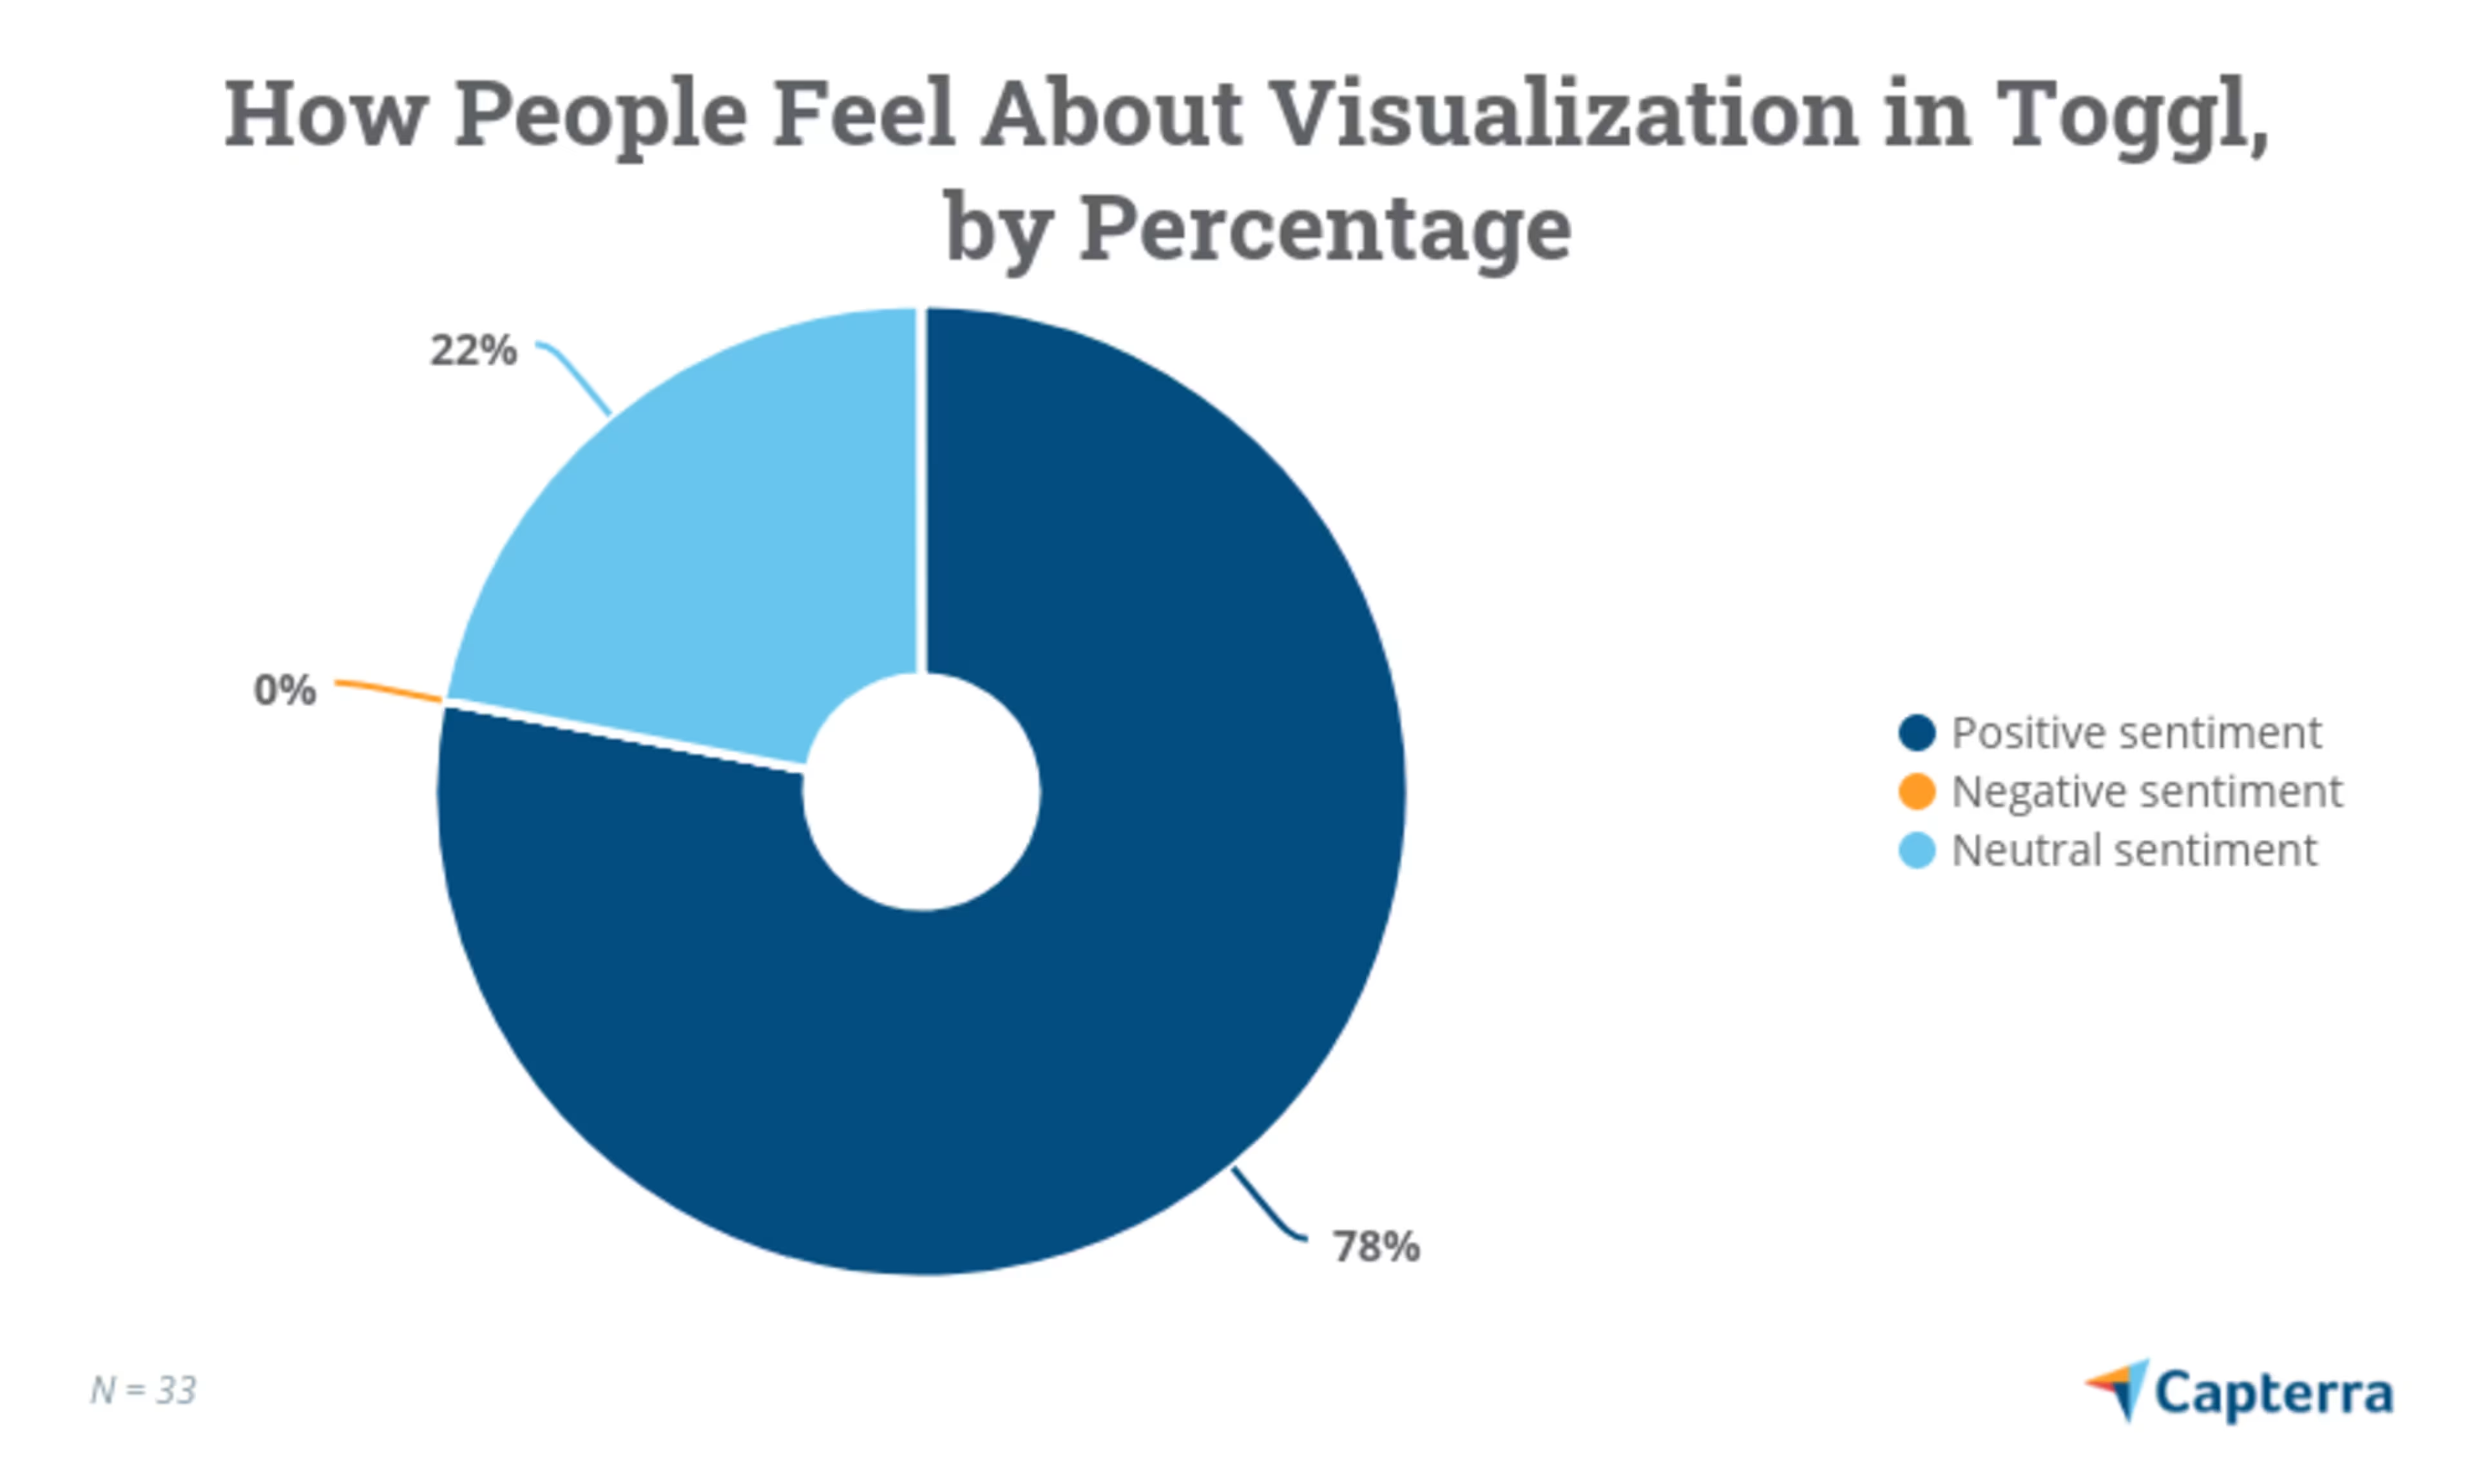
4. Toggl
Trial/Free Version
- Free Trial
- Free Version
Device compatibility
Toggl is a time-tracking tool suitable for teams of all sizes.
The software provides a live dashboard that helps monitor project status and analyze back-end data—such as time spent on tasks, resource availability, and costs—in real-time. Such analyses can help stakeholders understand their project dynamics and gain valuable insights to make informed decisions. Additionally, users get the option to generate and download interactive reports that can be shared with external stakeholders.
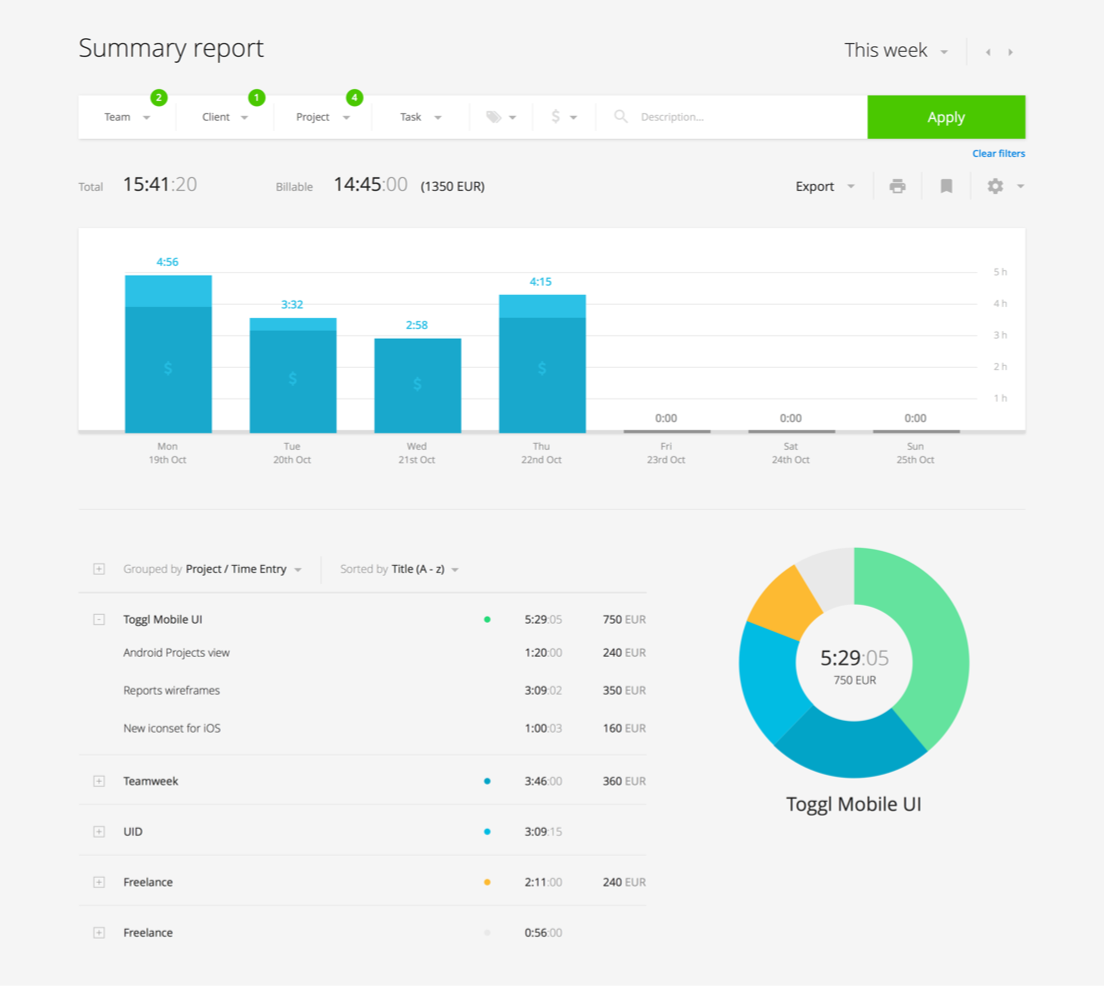
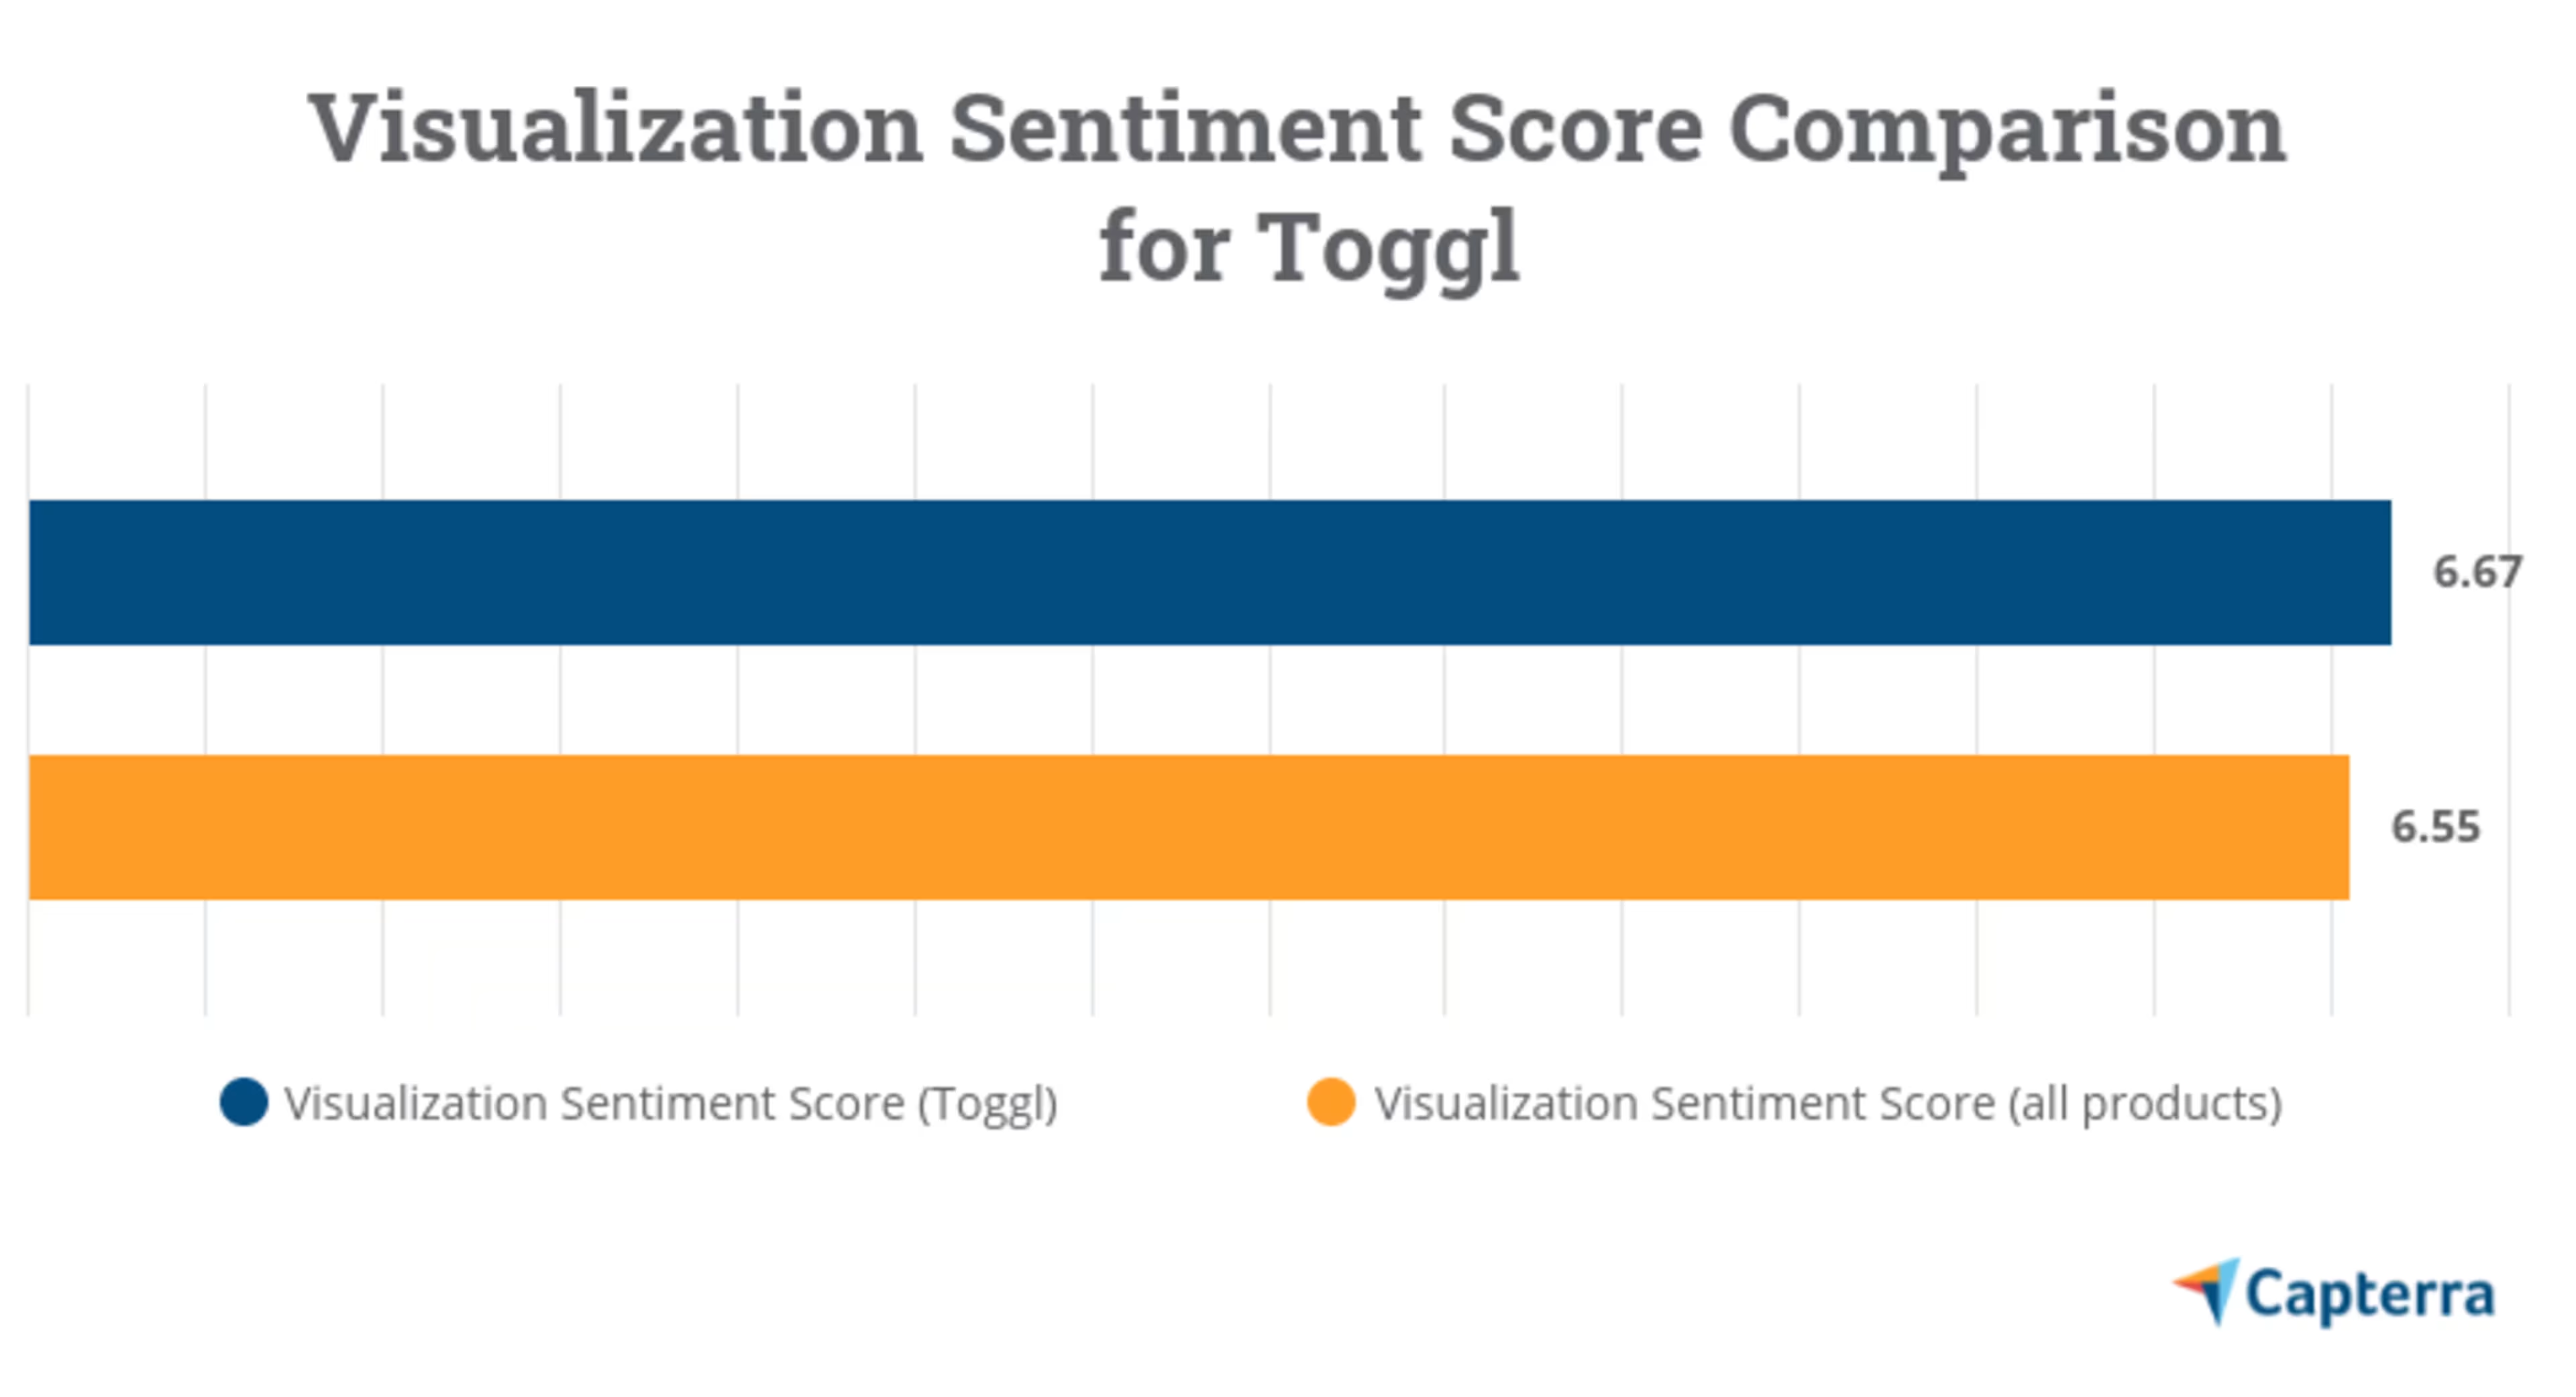
Toggl ranks fourth in our top project management solutions for visualization with a 78% positive sentiment.
Read user reviews for Toggl
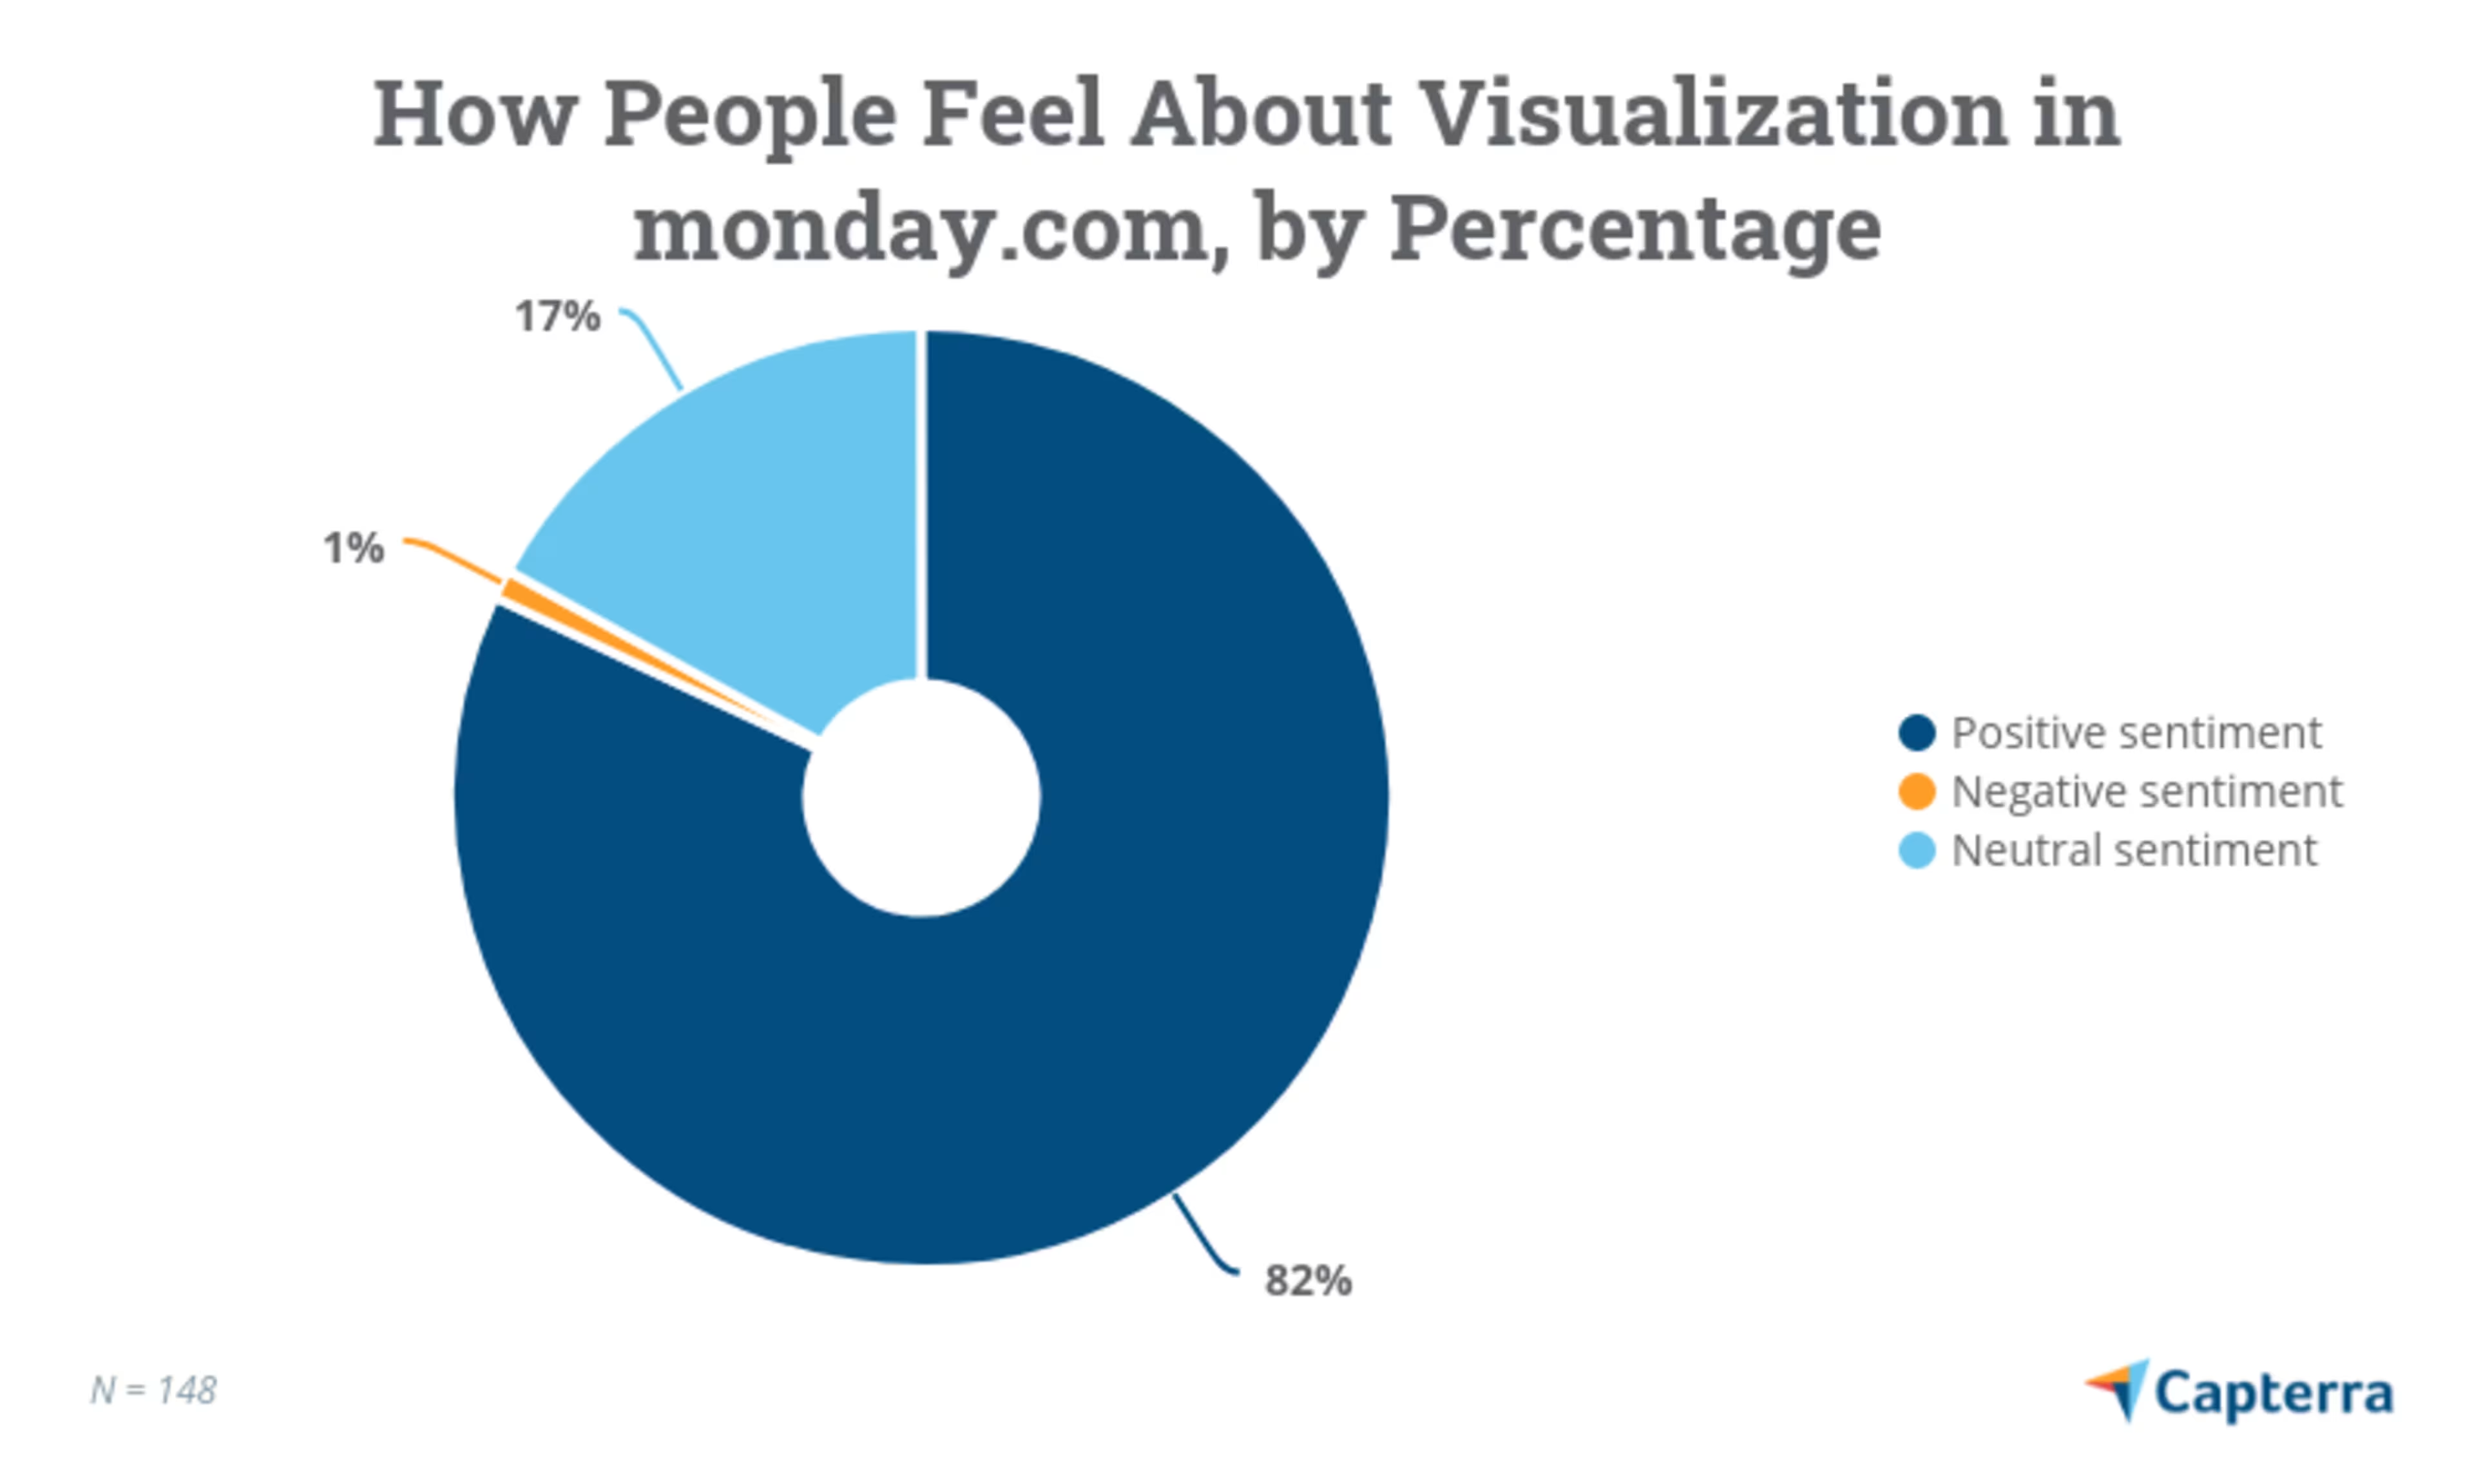
5. monday.com

Trial/Free Version
- Free Trial
- Free Version
Device compatibility
monday.com is a team management platform that offers several features to manage and monitor projects and team assignments. On the project level, users can track progress using the Calendar, Chart, Files, Kanban, Map, and Timeline views.
The software’s interfaces are highly customizable, allowing users to choose from a different set of colors and styles to match their business branding. It comes with a customizable dashboard with drag-and-drop functionality for highlighting important project aspects using a variety of graphs and charts.
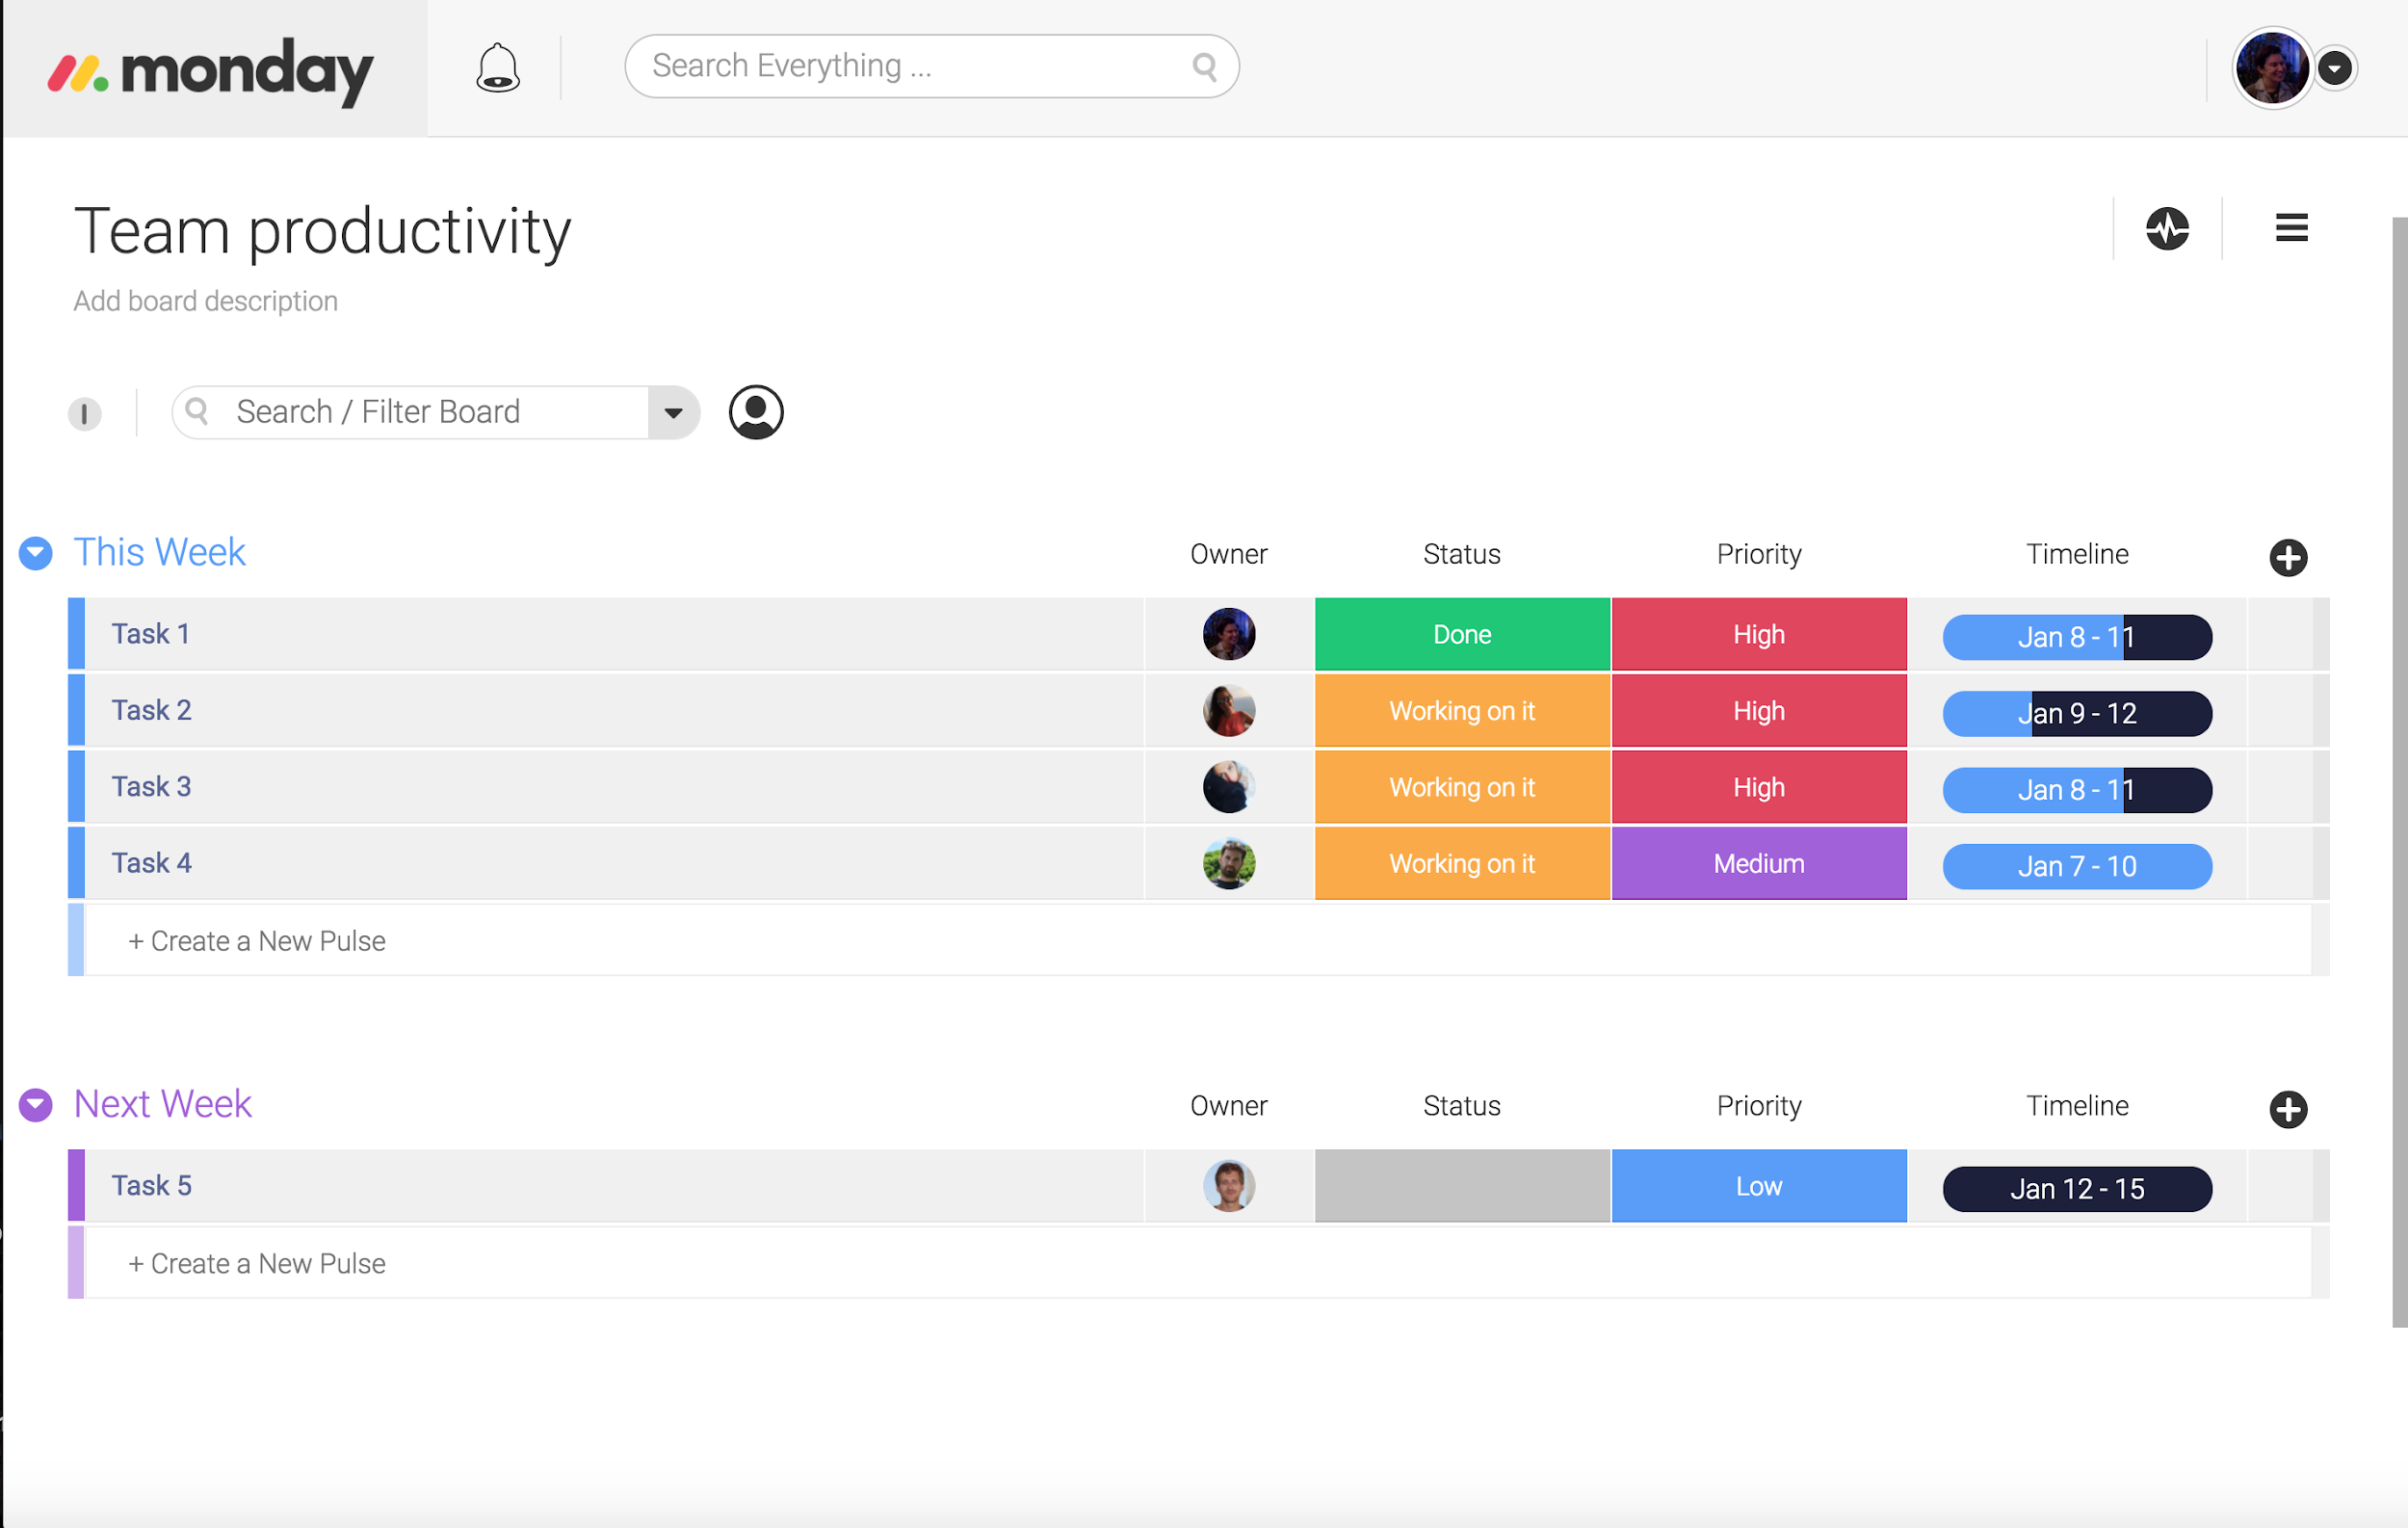
Monitoring team productivity with monday.com (Source)
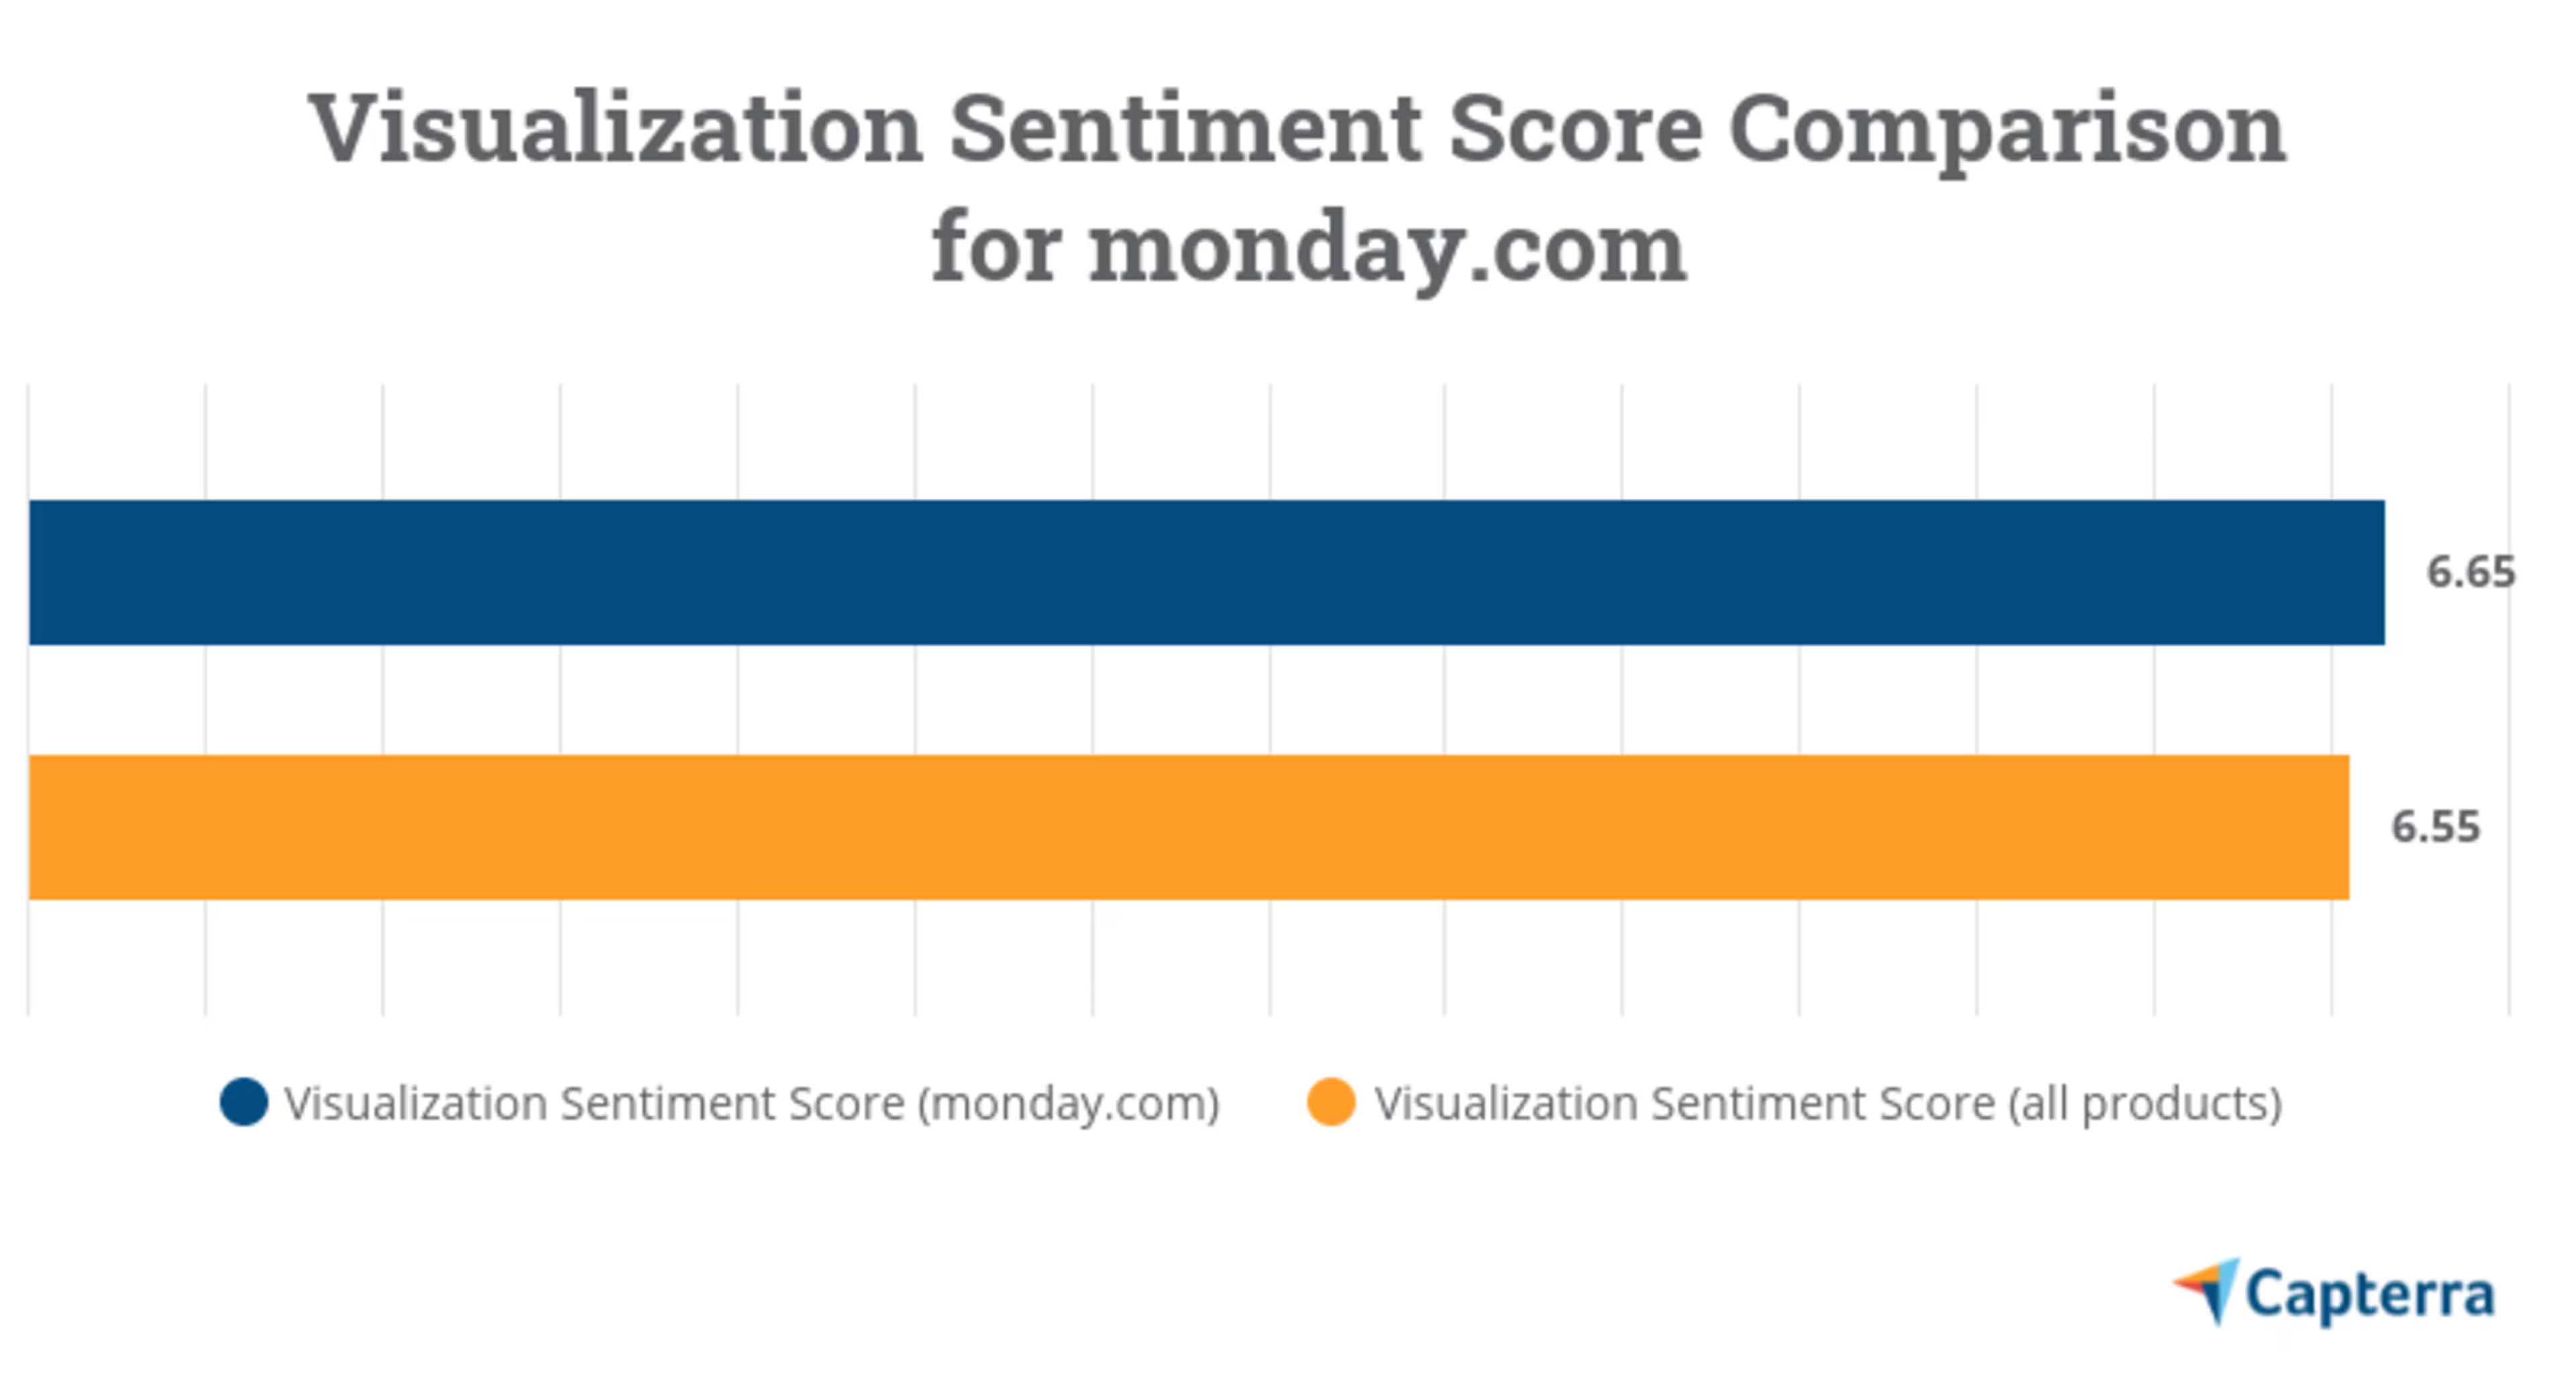
monday.com has over 80% positive sentiment, with just 1% of reviewers reporting negatively.