
Track your company’s performance with these ten key financial metrics.
Is your business flying blind without any guidance on financial metrics?
Running a small and midsize business (SMB) in the dark when cash is tight can leave too much room for chances, putting you at risk of insufficient funds for billing or payroll and, in the best case, leaving money on the table.
You can put affairs in order by leveraging the power of dashboards to get a broader view of how your business is doing financially. Plug into the barrage of data collected by your accounting and finance team—on who pays, how much, in what form, and for what product or service—to understand what’s actually happening.
Dashboards offered as part of financial management solutions or as stand-alone financial reporting tools provide a great deal of flexibility to drill down into metrics and do on-the-fly analysis.
What is a finance dashboard?
A finance dashboard is a reporting tool that consists of a hand-picked selection of metrics that gives an instant view of a company's finances and performance. It shows vital data points from the finance department in visual formats such as charts, graphs, and maps.
Unlike spreadsheets and static reports, finance dashboards are intuitive and can be customized to show the trends users want to track: sales, marketing, operations, supply chain, product, region, or more.
Modern dashboards not only help business leaders with descriptive charts and gauges but also provide prescriptive insights to make day-to-day management more effective.
Here’s a snapshot of a dashboard in a cloud-based financial management and accounting software tool:
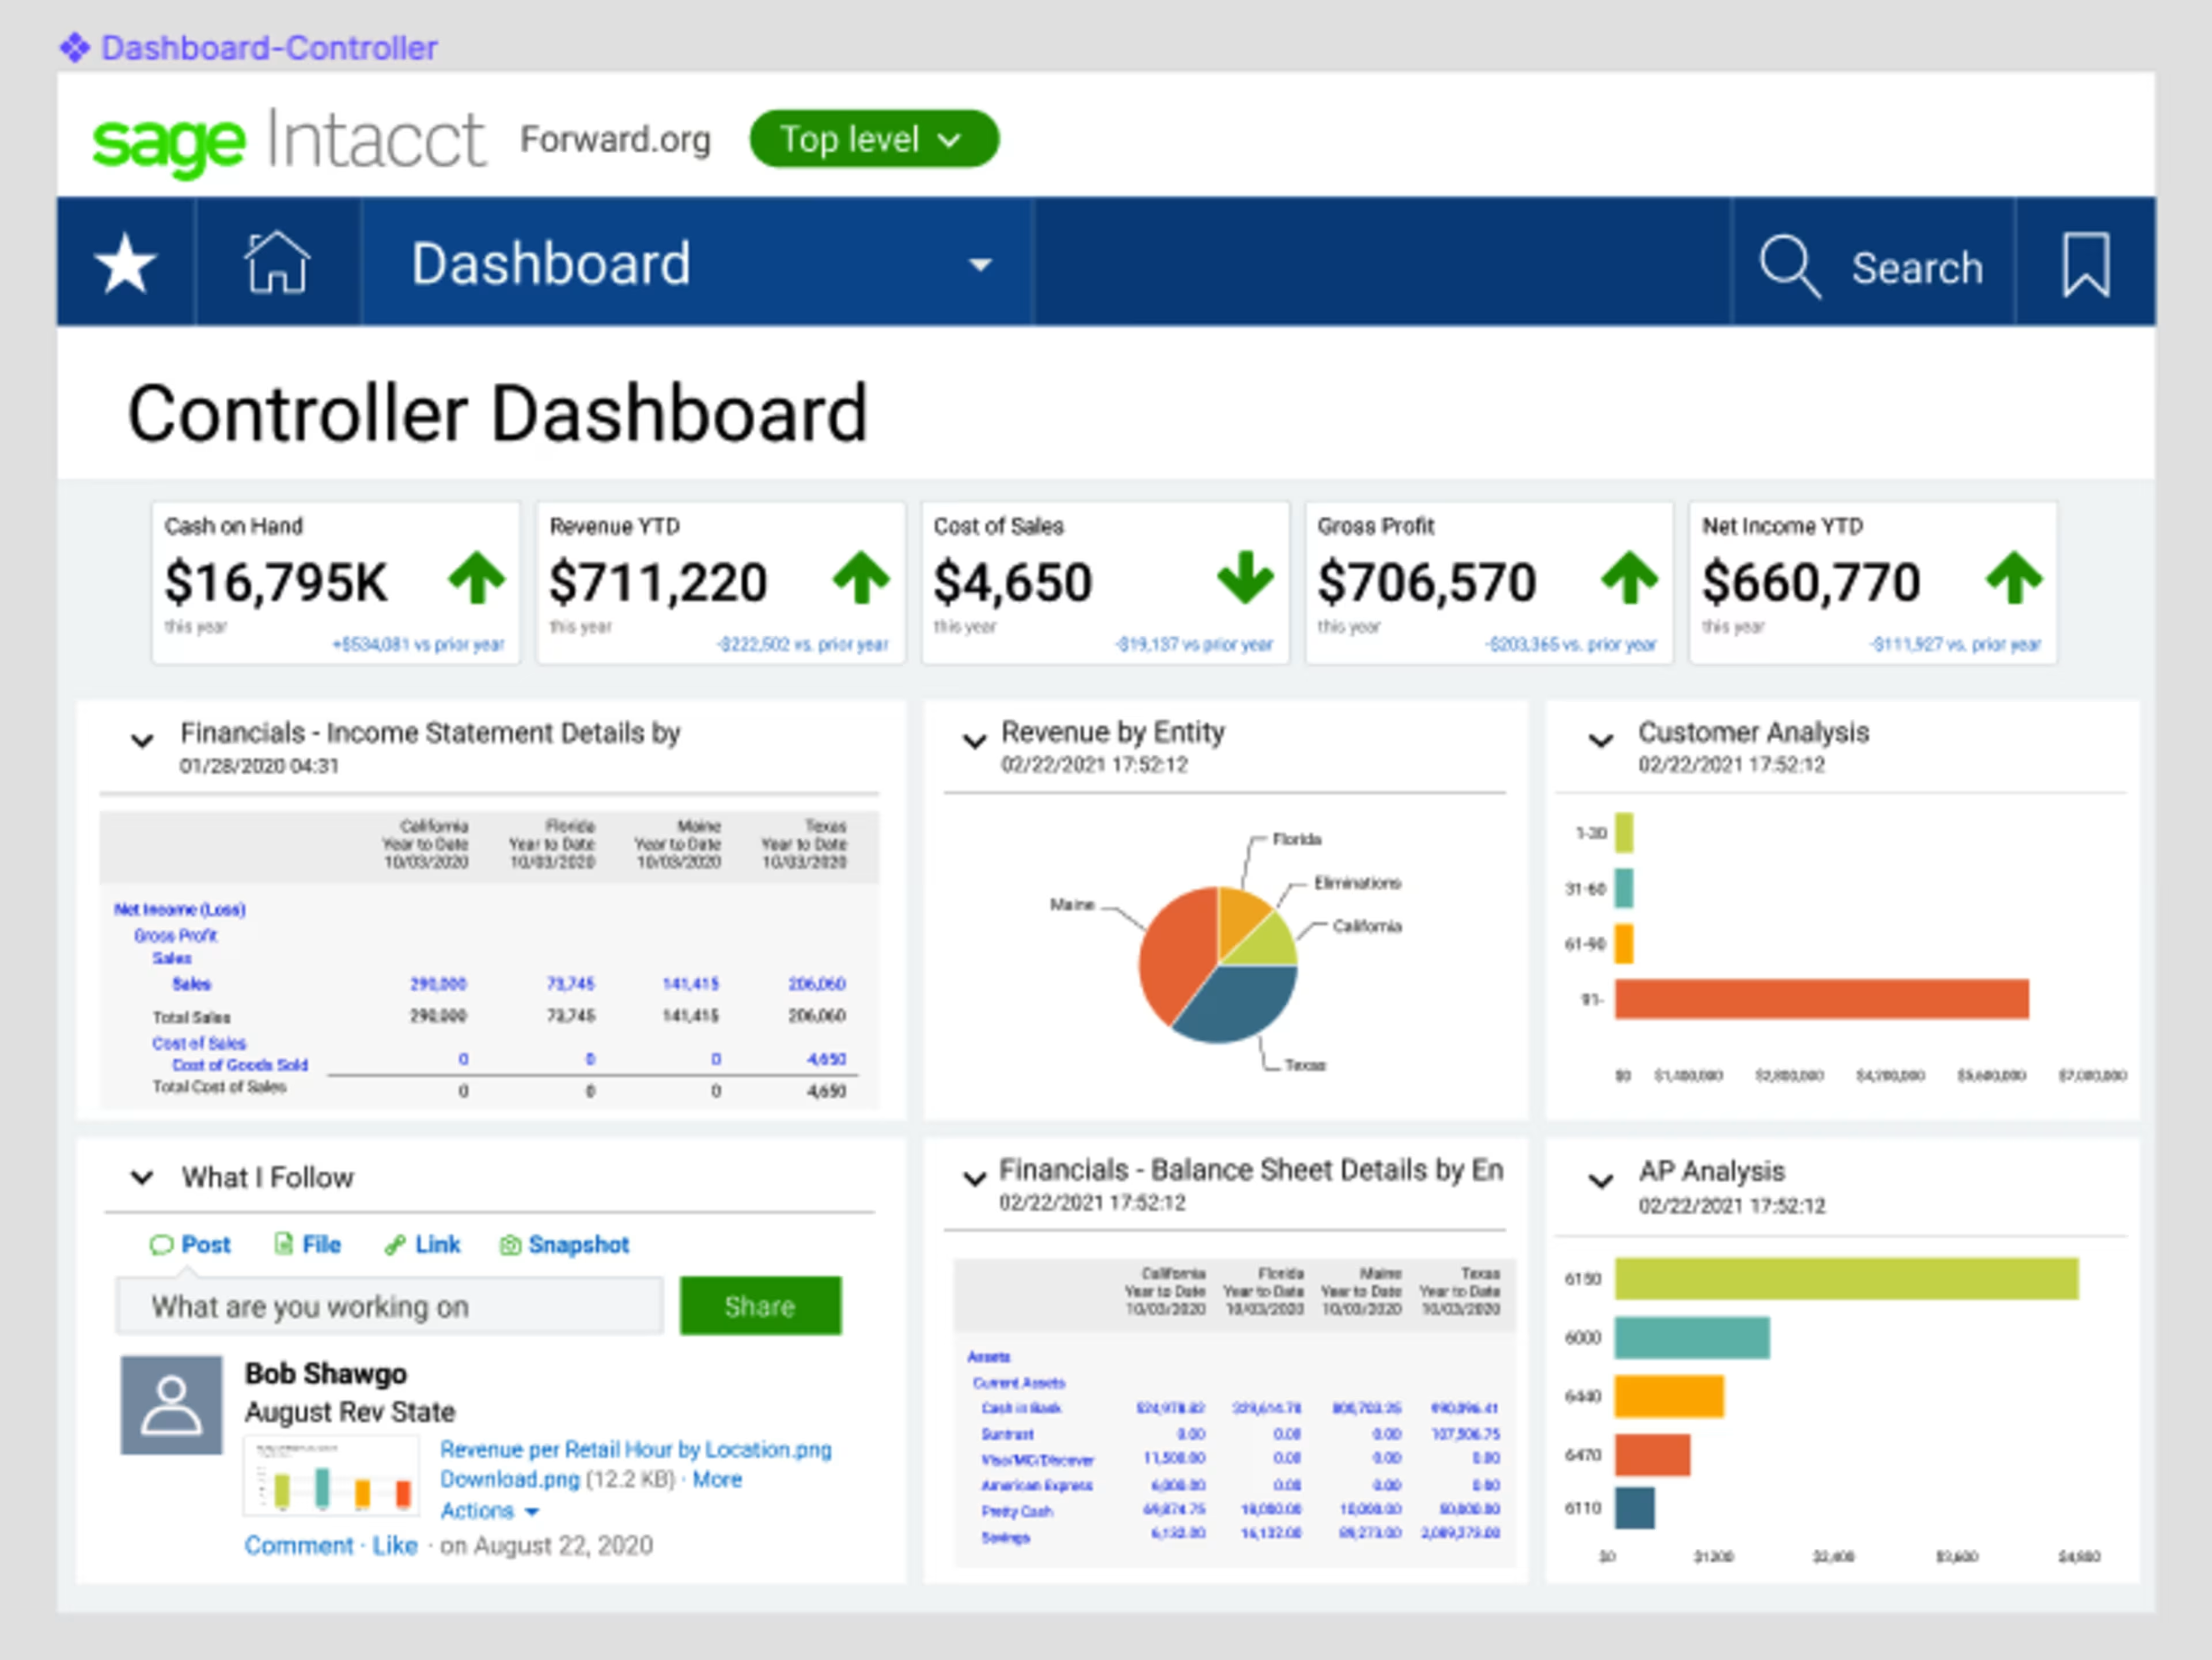
Controller dashboard of Sage Intacct displaying varying financial metrics (Source)
While most dashboards are informative, there’s such a thing as too much information on a dashboard. Overloading your financial dashboard with too much data or adding only “interesting to look at” indicators can disengage users from their key priorities. To identify which metrics to have on your dashboard, consider these three critical questions.
Three questions to identify the most critical metrics for your finance dashboard
Who will be viewing the dashboard? Identify who will use the dashboard to determine the kind of data they will need and the type of interactions or graphs to represent, among others. For example, if the dashboard is for a financial analyst, you could put in complex ratios. On the contrary, it’s advisable to distill the numbers for nonfinancial departments.
What are your business goals? Understand the decision-making goals that various users seek to achieve through the dashboard—say better productivity, reduced costs, or maintaining cash flow—and chart critical metrics according to those goals.
How do you avoid metric overload? Picking the right metrics is an evolving task. Selecting too many or too few, both can be inadequate to capture the progress you intend to make. Collaborate with other teams and business leaders to identify which important metrics you should have on the dashboard.
Pro-tip
Dashboarding best practices indicate that eight to 10 metrics are perfect to give a rounded view of business performance. You can use multiple dashboards, such as one posted publicly on a website showing your company's growth and one with confidential and detailed information for senior leadership only.
The metrics you set up on your financial dashboard will depend on your business goals and target audience. That said, we’ve outlined 10 metrics that are a great starting point to track your business performance.
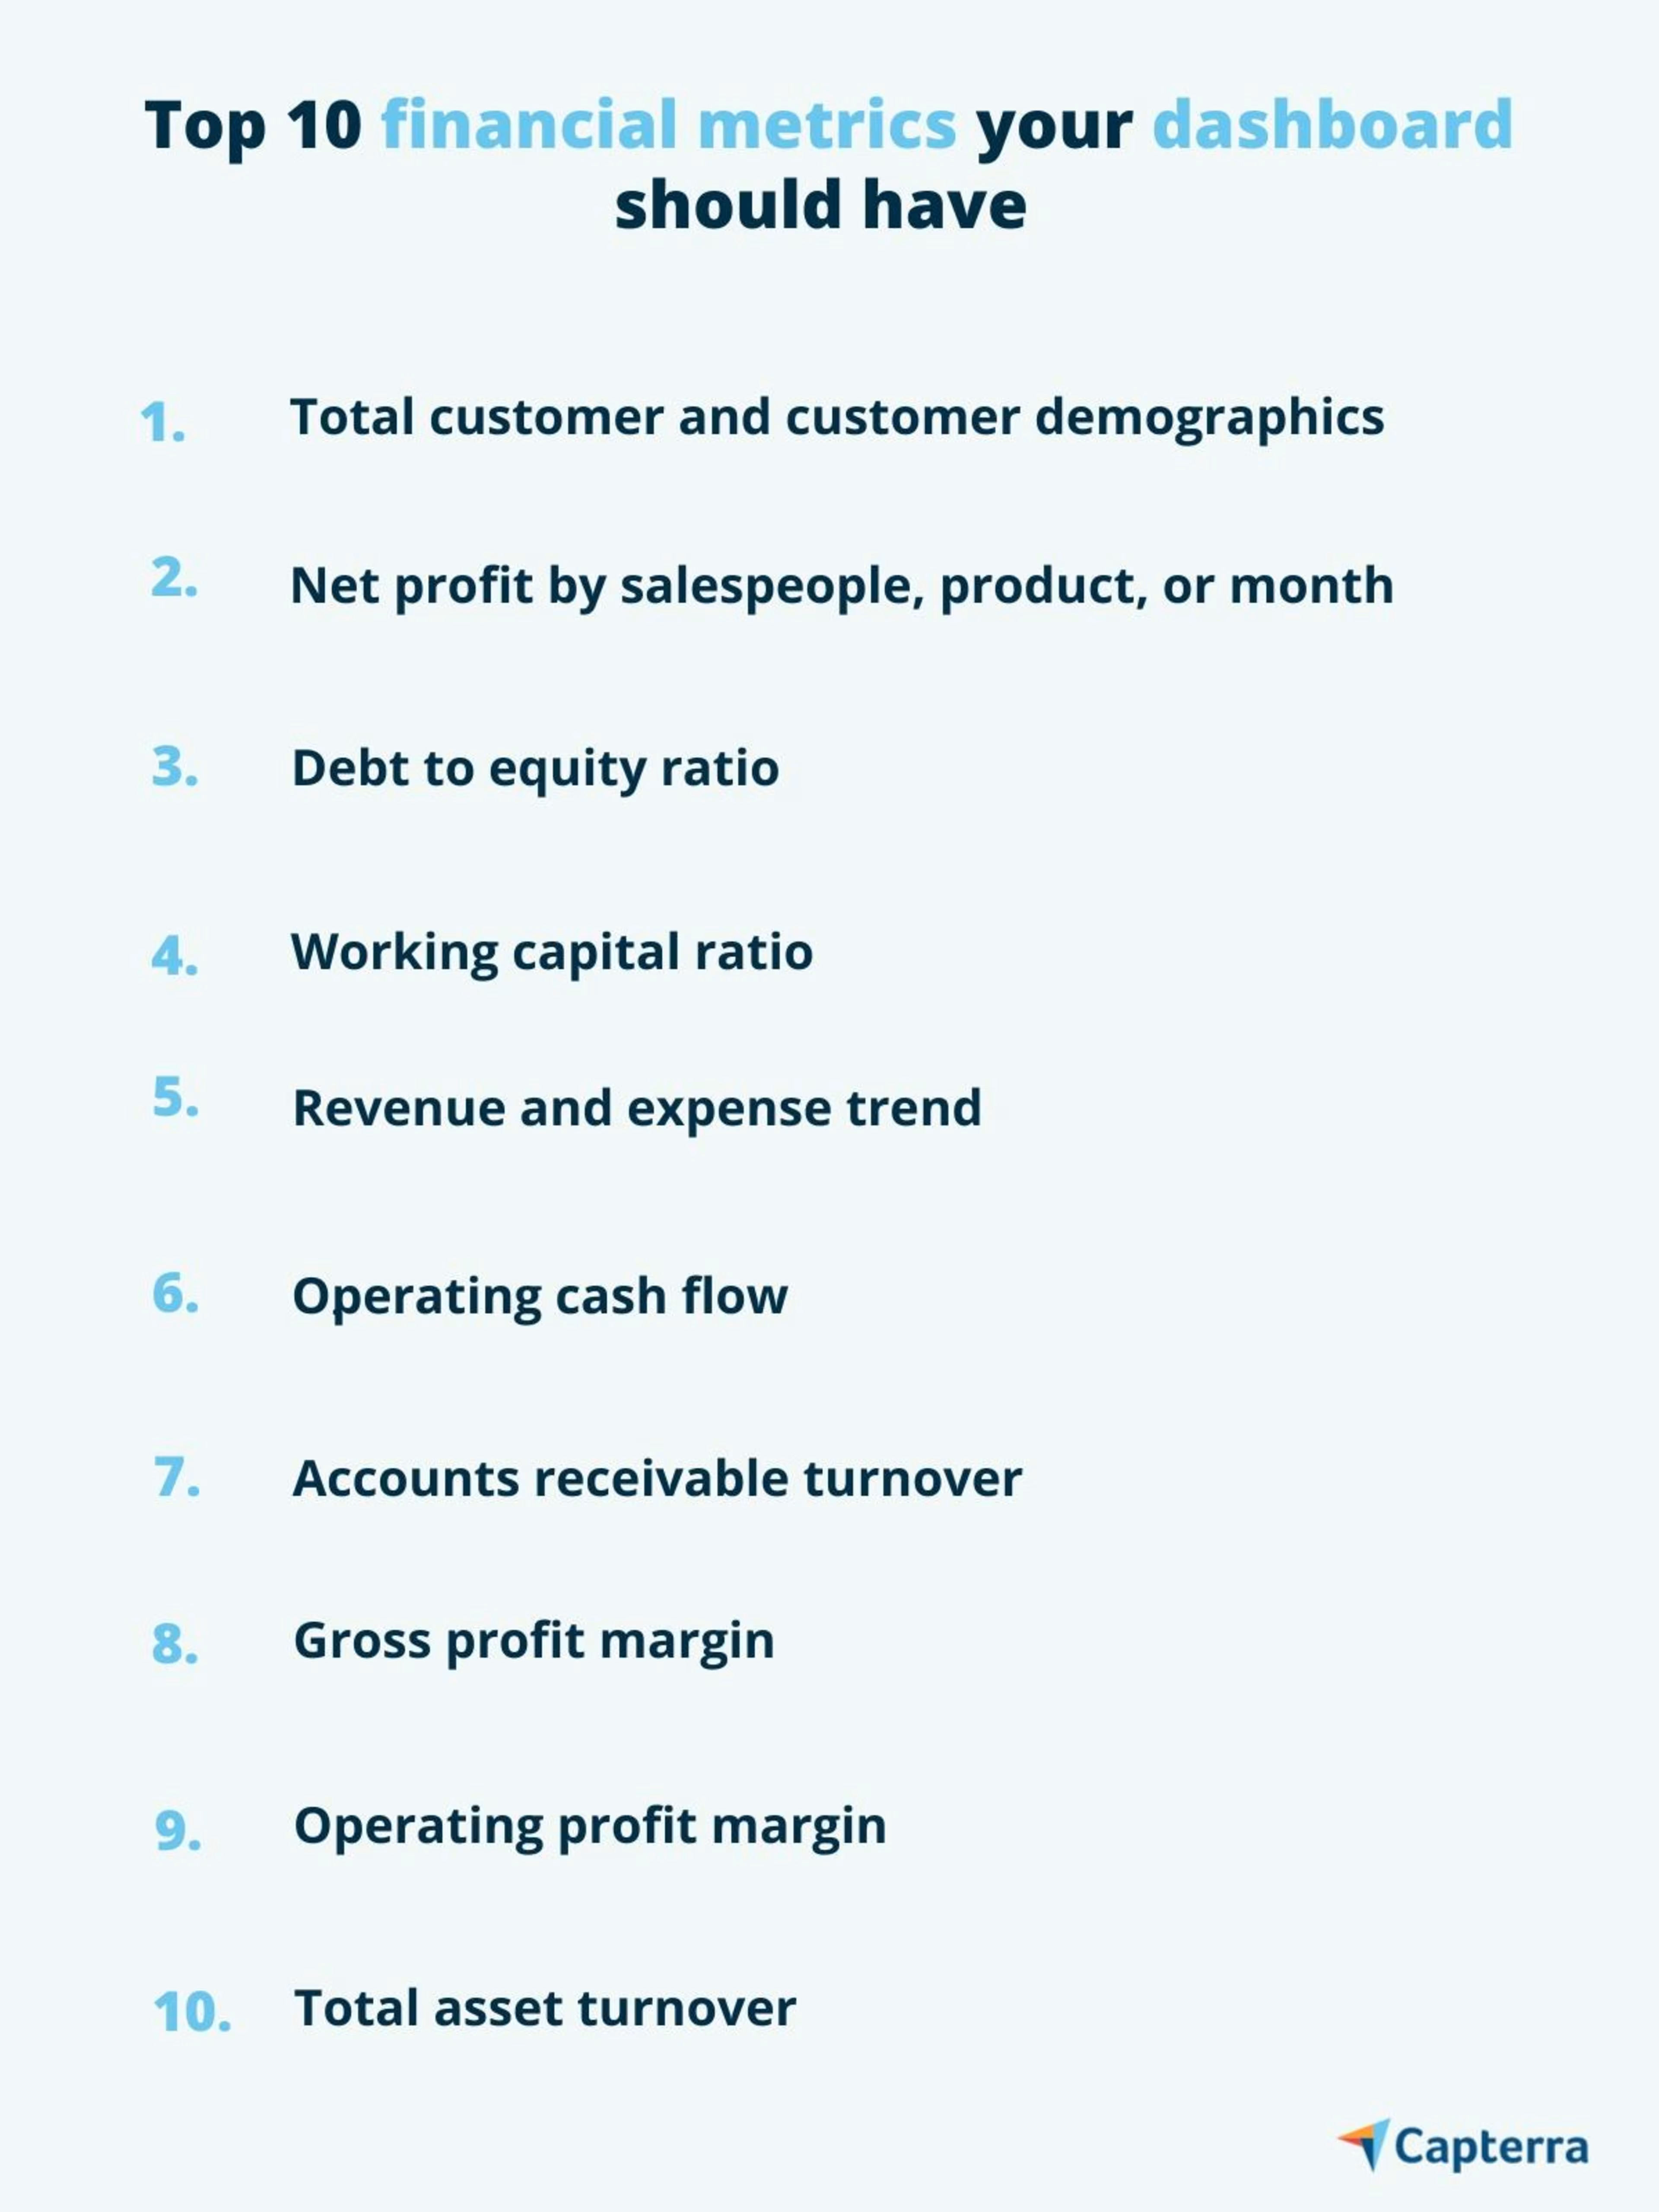
1. Total customers and customer demographics
Get the most current data on the total number of customers on your dashboard. Break it down further by gender, profession, and other demographic factors to get a peek into who your customers are and how to improve your approach to capture more prospects.
2. Net profit by product, month, or salesperson
This metric measures your business’s net profit, which is the amount you make after deducting all expenses, including the cost of goods sold, operating expenses, and debt, from your revenue. You can also dissect your net profits further by product, month, or salesperson.
3. Debt-to-equity ratio
It measures how your business is funding growth—by debt or equity—and raises a red flag the moment operations start becoming too dependent on borrowings or credit. A high ratio indicates high debt levels, which isn't great for your company’s financial health.
Note: The first three metrics are high-level key performance indicators (KPIs). They give a big picture of your company's present and future performance, such as expected sales and monthly trend on profit. They are most commonly used by senior-level executives to monitor company performance against goals.
4. Working capital
It measures your business’s financial health by estimating readily available resources that can be converted into cash within a financial year to fulfill short-term payment obligations. A positive working capital ratio indicates that you can comfortably fund your present and future operations while also maintaining your debt repayment capacity.
5. Revenue and expense trend
Chart the total income you receive against your monthly expenses. Dissect your expenses and revenue further by the type of product or service. You can drill further into this metric by comparing actuals to budgeted or forecasted numbers and reflecting any deviation in a trend chart.
6. Operating cash flow
It measures the total amount of money generated by regular business operations. Tracking this metric will help ensure your business has enough cash after funding day-to-day operations and expenditures. A positive operating cash flow indicates your business is thriving.
Note: The fourth, fifth, and sixth metrics are operational indicators that monitor the current working of your organization. This part of the dashboard gives a simple, easy-to-view overview into the way things are now.
7. Accounts receivable turnover
This metric assesses how quickly you are receiving revenue from the goods or services sold on credit. It gives deeper insights into the paying ability of your customers by showing how soon they settle down the credit extended to them.
8. Gross profit margin
It measures your company’s production efficiency over time. It shows how effectively you are managing your labor and production supplies. Falling gross margins can be quite worrying, as they indicate that your operations are becoming unfeasible, with the cost of producing goods or services going higher than the revenue they are generating.
9. Operating profit margin
It measures your company’s income after deducting the nonproduction cost of goods sold, such as selling, general, and administrative expenses, which are also known as overhead costs. The costs of hiring sales staff and advertising are some examples of the expenses included when calculating the operating profit margin.
10. Total asset turnover
It measures how efficiently your company is utilizing its assets—tangible or intangible items of value such as cash, computers, and intellectual property—to generate revenue. The higher the turnover ratio, the better your company's financial performance.
Note: The final four metrics are pure financial indicators that track the “viability” of your company and its business model. They check if your business has the potential to be successful. These metrics are often sought by investors to analyze business health.
Selected your key metrics? Here’s what to do next
Once you’ve selected the metrics you plan to use on your financial dashboard, take these steps to make it a reality:
Consolidate your data sources. Dig out the sources from where the dashboard will fetch data to populate your metrics. Financial metrics typically source data from multiple departments, including sales, marketing, production, and administration. You can consolidate historical transactions from your current enterprise resource planning (ERP) system. But if your finance department still uses Excel, create a separate organized spreadsheet and include relevant labels for the final dataset you want on your dashboard. Also, key in analysis from your profit and loss statement, balance sheet, cash flow statement, budget and forecast, and any other financial statement.. Visualizations on a financial reporting dashboard will yield strong insights only if the data backing them is accurate, complete, and relevant. If you haven’t yet, unlock the full potential of your financial data by automating critical accounting tasks to better prep your data and source it easily.
Use the right technology and tools. Data visualization is an evolving field with plenty of software tools that offer powerful designs and intuitive interfaces. Invest in tools that can easily integrate with your current technology stack. Visit Capterra’s dashboard and data visualization software pages to read user reviews and check ratings as you explore and shortlist tools for your finance and accounting department.
Want to learn about hiring an accounting firm? Capterra’s list of the top accounting firms and their features will help you narrow your search. Learn more in our accounting firm hiring guide.
Note: The application selected in this article is an example to show a feature in context and is not intended as an endorsement or a recommendation by Capterra. It has been obtained from sources believed to be reliable at the time of publication.