
You think you know your biggest competitors. Certainly, there are those companies that spring to mind first—same industry, similar business model, etc.
You can easily name the reasons you consider them competitors—but simple overlap really just makes them your rivals. Thus, creating your pricing strategy process solely by looking at these uncompetitive competitors can be brutal for your business.
Luckily, there's a simple workflow you can follow to single out your actual competitors, calculate their impact on your sales, adjust your pricing strategy, and avoid pricing wars.
How to define your actual retail competitors
To find out who influences your sales, you must calculate your price index.
Theprice index (PI) is a normalized average (typically a weighted average) price relative to a given class of goods or services in a given region, during a given interval of time.
While Wikipedia gives complex formulas to explain the idea of PI, we're here to share a simple method you can apply directly to your business with minimal effort.
The simplest example of price index usage is when, at the end of the week, a retailer wants to discover the reasons for its net profit decrease. As long as price index is directly connected to sales, it's easy to see using historical sales and price data.
Below, we'll start by breaking down the various equations you'll use to create graphs for visualizing the impact potential competitors have on your sales. Then we'll show you how to actually apply those equations to create your graphs.
Essential price index equations
Understanding how the price index is calculated is incredibly useful, as it helps you understand why the data you use is so important. We'll dive into the details now, so that we can discuss their application further along.
To calculate the price index, first, list all pricing product pairs—intersections of your and your competitor's products—with an available price.
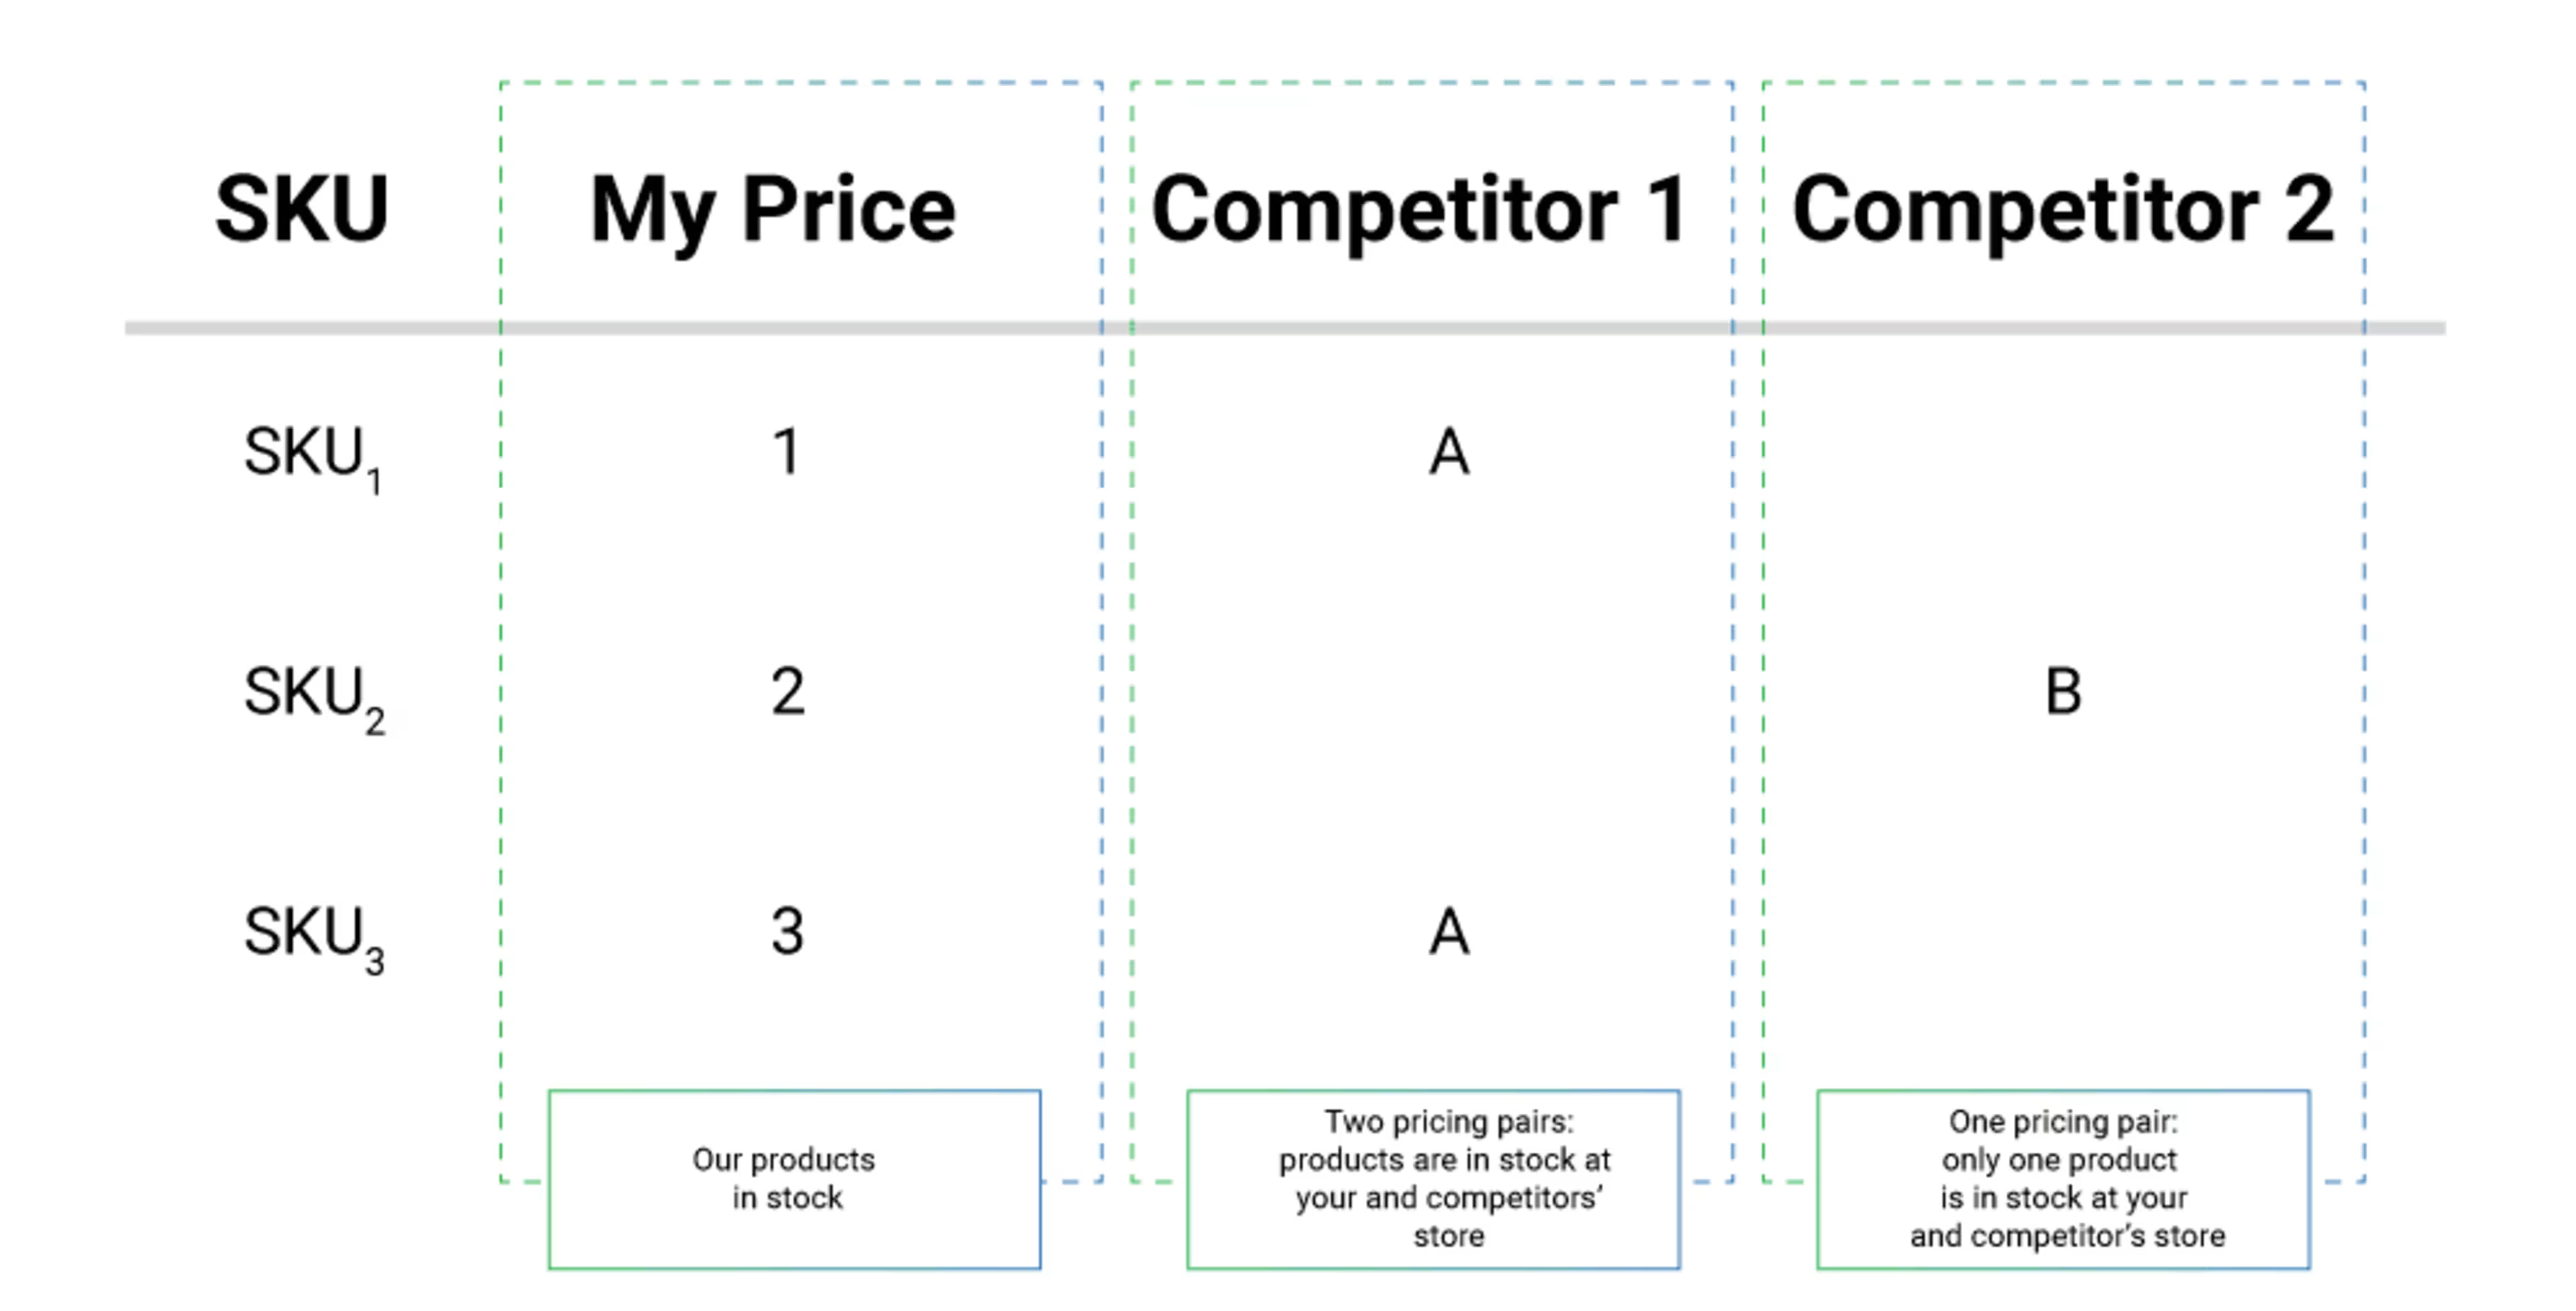
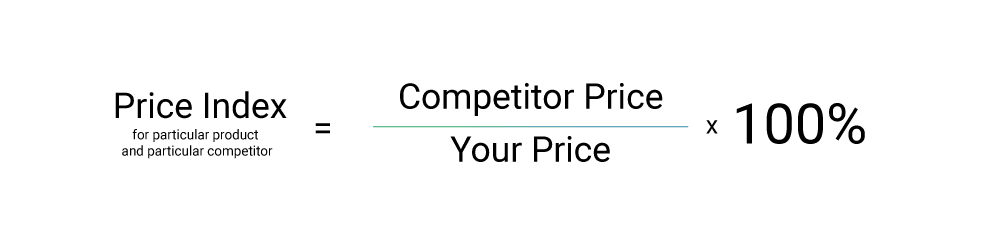
Then, to calculate the price index for each product for each potential competitor (remember, we're discovering who your real competitors are through this process), divide that competitor's price by yours.
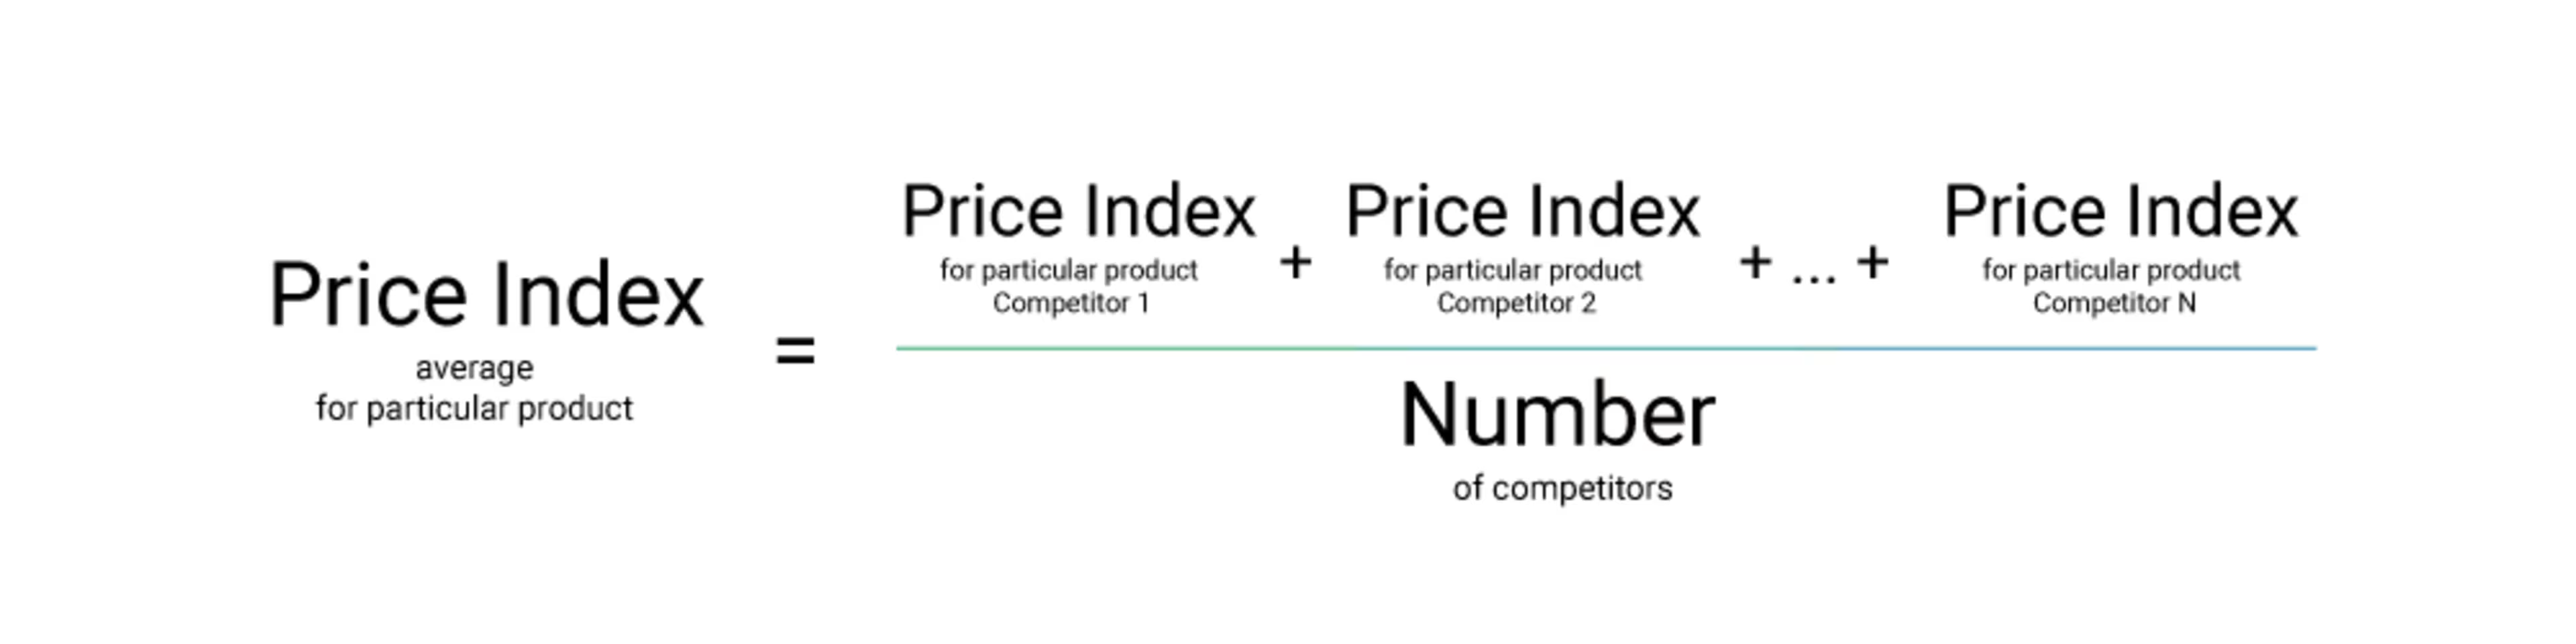
To see the average price index for a product, add up the price indexes for that product from all of your competitors, then divide by the number of competitors.
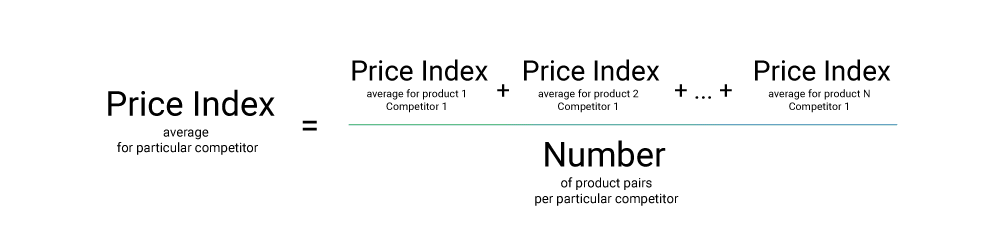
The last calculation you need to make in order to see the competitor's impact on your sales is to define the average price index by competitor.
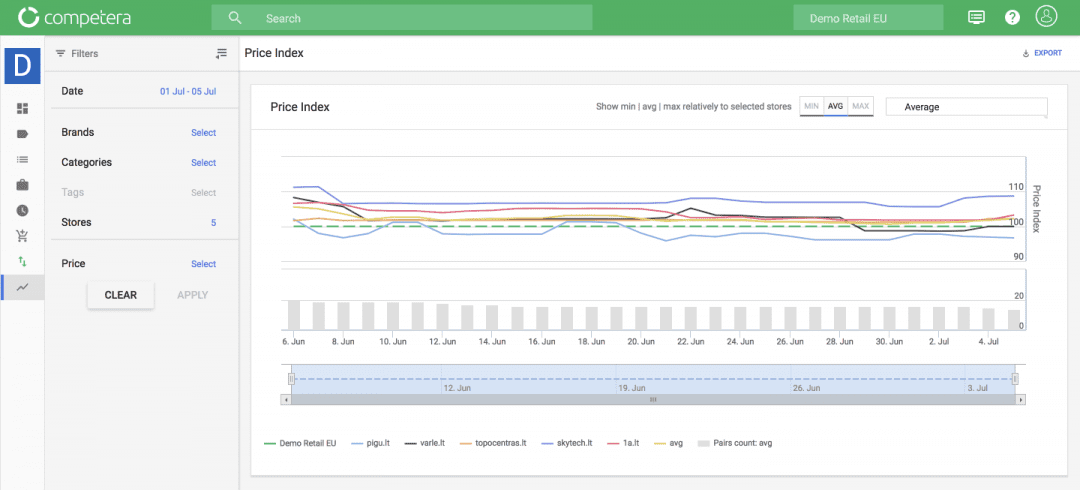
The last step to is to visualize all the data you've received using a graph to discover all the deviations. Here, we're plotting the competitors' prices over time as solid, shifting lines. The dotted line is your price over time (unchanged here).
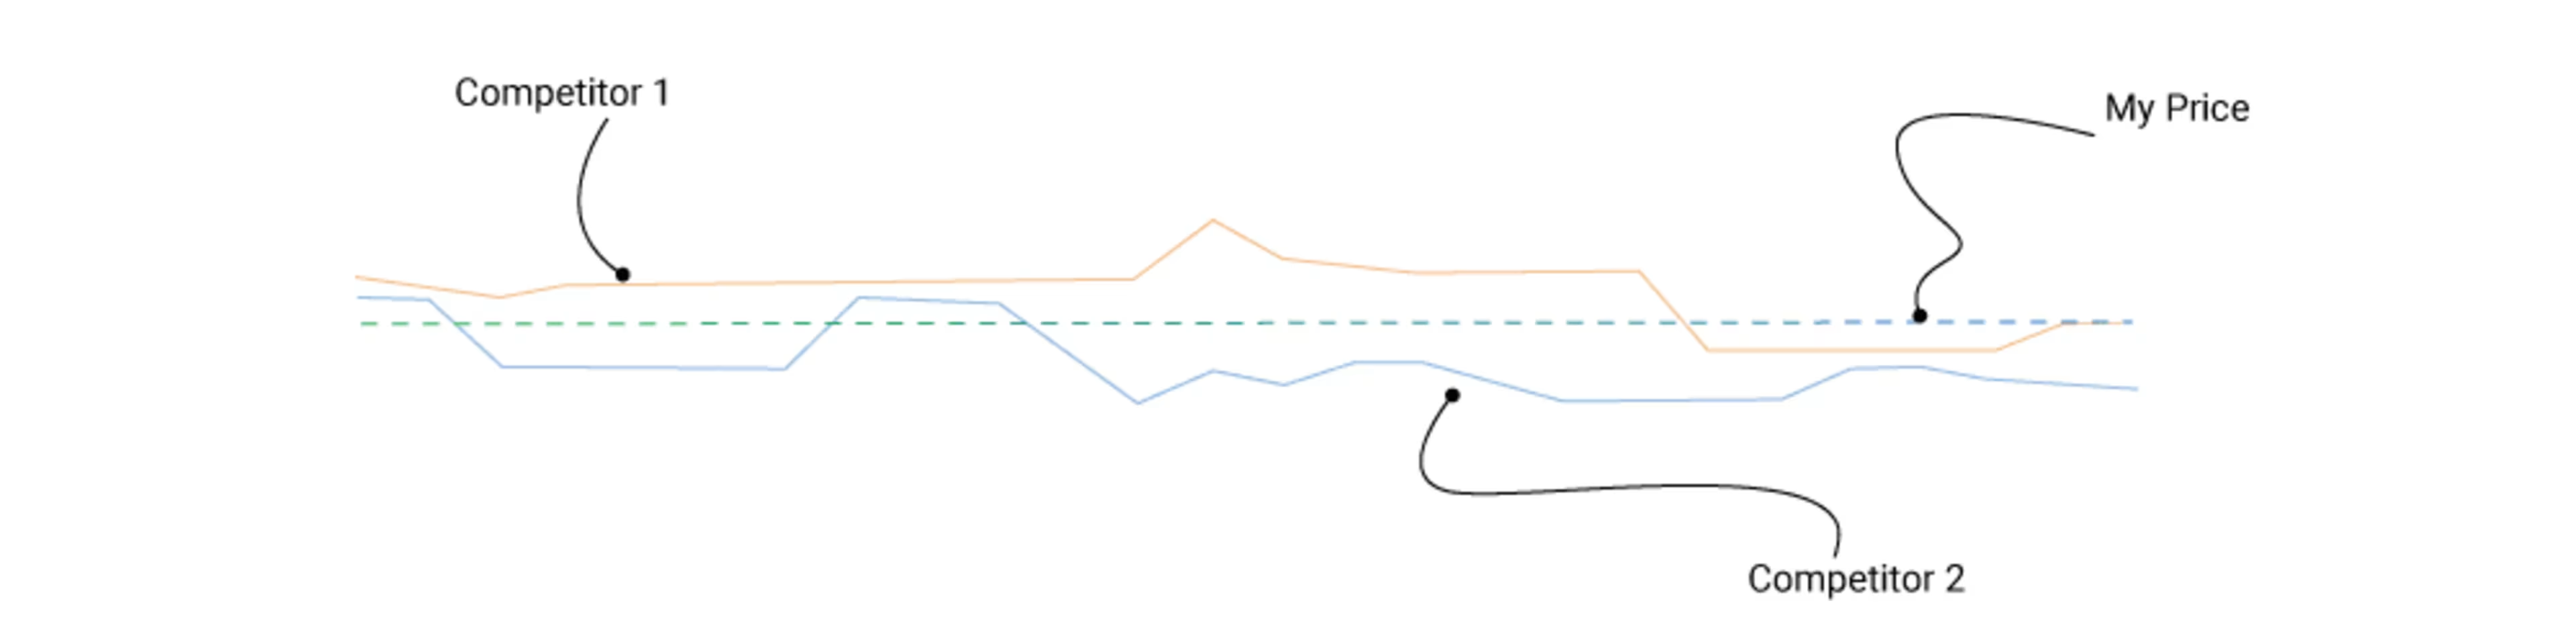
Now you can see all the price deviations. If you add your sales metrics to the same graph, you'll be able to easily define who exactly impacts your sales (mostly Competitor 2 in the graph below).
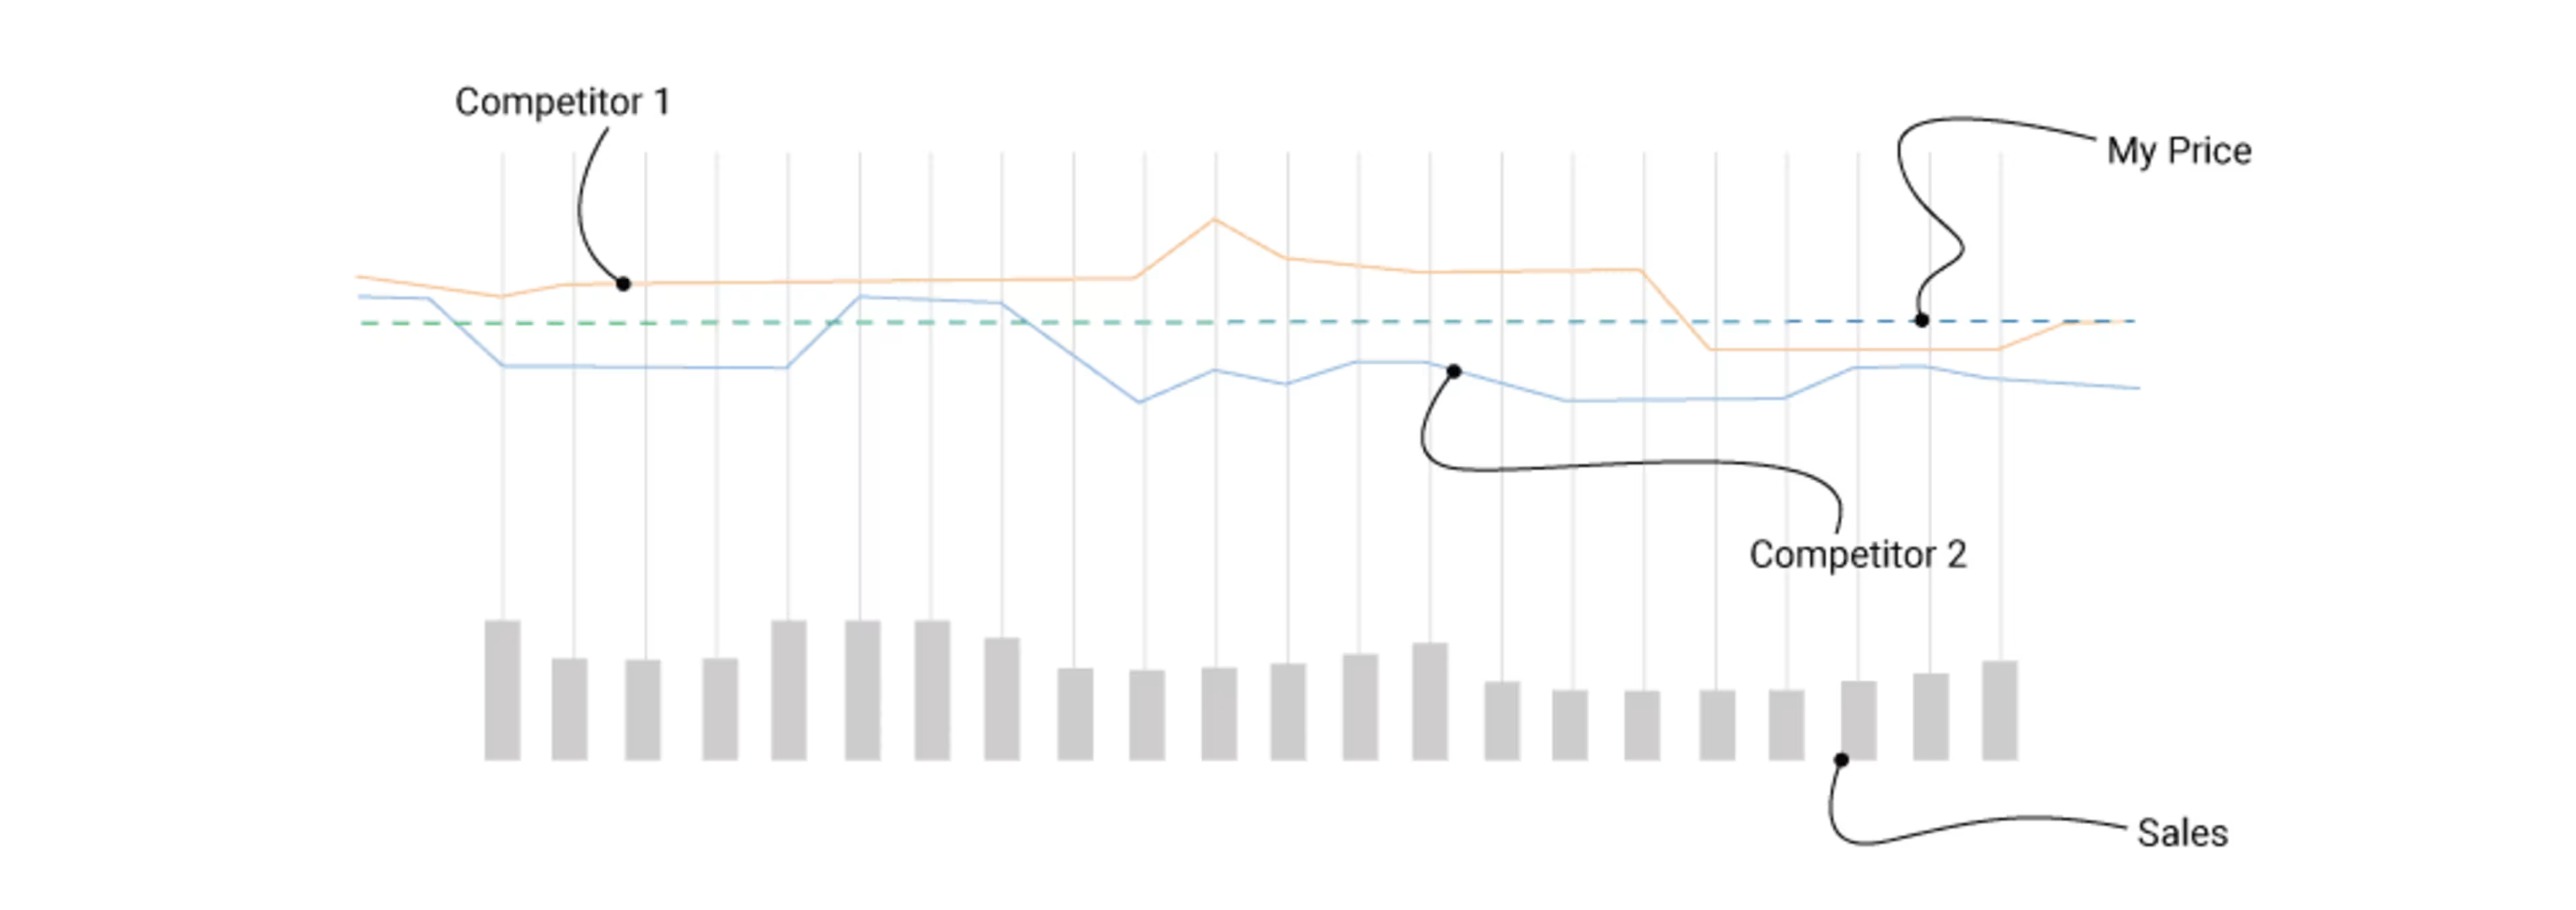
This chart shows that, over a given period of time, your basket of products has usually been cheaper than Competitor 1 and more expensive than Competitor 2. You can also see that, when Competitor 2 has sharp price drops, you see a decline in total sales (as shown in the grey bars).
How to visualize the price index data
Here's a simple flow you can follow to calculate the price index using the above formulas.
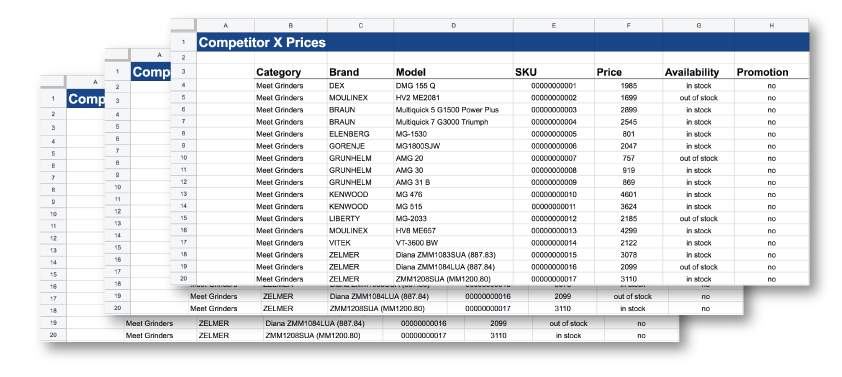
Collect fresh and reliable competitor data on prices and stocks. To get a reliable result, you need to use reliable raw data. That's why you need to monitor competitor's prices and stocks daily. For some industries (e.g., electronics) maybe even multiple times per day. Without good, fresh data, you'll be “tilting at windmills."Create a single spreadsheet with all the data you've collected. In order to manage and manipulate all the data, you need to store it in a single place.{{{asset:33374}}}Apply formulas from the previous section. You can easily manage this process, as long as you're already familiar with Excel or another spreadsheet software.{{{asset:33375}}}Build a chart. This point isn't necessary, but it's very useful to literally see all the deviations and recognize the dependencies between competitors' changes and your sales results. {{{asset:33376}}}
Add all your sales data. As we mentioned before, the price index is useless without sales data. The price index shown by itself will give you market data, but tell you nothing about market impact.
Discover the exact activity that affected your sales. By moving from the bird's-eye-view to the data of current date-competitor-product, you'll be able to see what caused the market change and affected your sales.
Next steps for calculating your price index
It's not as easy to implement this process as it might seem.
The first issue retailers usually face is regarding data quality. Some of them grab data from marketplaces, instead of their rivals' websites. Some use self-made parsers, which are often buggy and imperfect. Some hire people to do it manually or buy cheap solutions that deliver low-quality data. And poor data leads to poor pricing decisions.
When the data quality issue is resolved, the next factor—the human factor—steps into the game. When our clients share their experiences, there are common problems with human error. This shows up at different stages, including the parsing, data merging, data managing, and price changing stages.
So, while it is possible to define your key competitors in 15 minutes, the preparation process for getting to that point can be complex and long. That is, unless you're using an advanced pricing solution that allows you to automate all the processes on data mining and merging and price comparison and changing (check out a dedicated case study with an implementation of such solution).
With that said, if you define your key competitors correctly, you'll be able to choose the best products for promotion, set competitive-yet-profitable prices, forecast demand and inventory, and increase total sales by driving associated products.
Calculate your price index, discover your market landscape, granulate actionable insights, and make smarter business decisions! For more retail tips, check out Capterra's retail blog or browse retail management tools in the directory.